DATA AND CREATION: THE ZPE-PLASMA MODEL Barry and Helen Setterfield, March 2009
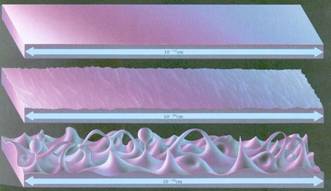
There is an almost universal feeling, which is encouraged by secular science, that one must make a choice between science itself and the Bible. However, if the Bible is true then God does not lie, either in His Word or in Creation, and we can confidently follow the data to find out what is being referred to in the creation account of Genesis 1. Thus, seeking out the data should not be a matter of trepidation, but rather of excitement and discovery. The cosmological model presented today in schools and the media involves the Big Bang and the effects of gravity. The idea is that the universe suddenly expanded from an infinitesimally small bit of something to its present size and is still expanding. This current expansion is concluded from something called the red shift of light from distant galaxies. The formation of these galaxies themselves, as well as stars and planets, is thought to be the result of gravitational forces. This model, however, has incurred enough problems for theorists to find the inventions of such things as dark matter, dark energy, and dark force to be a necessity for the model to work. If we compare that model to the Bible, we have no problem with the fact that the universe was expanded in the beginning. Twelve times God says He did it. At least that explains where the initial energy came from. However the Bible considers the expansion to be a finished act. This needs to be examined. If we compare the BB/gravitational model to what we actually see in outer space as well as in our labs, we are confronted with something much different from, and much stronger than, gravity. This is plasma. Plasma is the fourth state of matter, different from gas in that one or more electrons have been stripped off some or all of the atoms. Plasmas are involved with very strong electromagnetic fields. Plasma filaments quickly produce all the forms of matter we see in space without the need for dark anything. This also must be examined. On the other side of the old-age/young-age arguments is the standard creation model which says the universe is about 6000 years old and that Noah's Flood laid down the vast majority of both the geologic column and the fossils. In order to support this model, a good deal of Egyptian history must be eliminated, the specific layering of fossils explained, and explanations made for some interesting problems in the geologic column. The data points to something other than the standard creation model and time. But, then, so does the Bible. Then let’s examine the data. A lot of effort has been put into trying to get the data to match the Big Bang hypothesis. A lot of effort has been made to try to get the data to fit the standard creation model. It’s time to let the data do the talking and see where it leads. II. PLASMA, A ZERO POINT ENERGY, AND THE COSMIC BACKGROUND RADIATION In the early stages of the universe's expansion, energy was being invested into the fabric of space. In a similar way, the stretching of a rubber band or the inflating of a balloon invests energy into the fabric of a rubber band or balloon. It might be wondered what the "fabric of space" consists of. Quantum physicists consider the fabric of space to be some sort of quantum “foam.” This is illustrated in Figure 1.
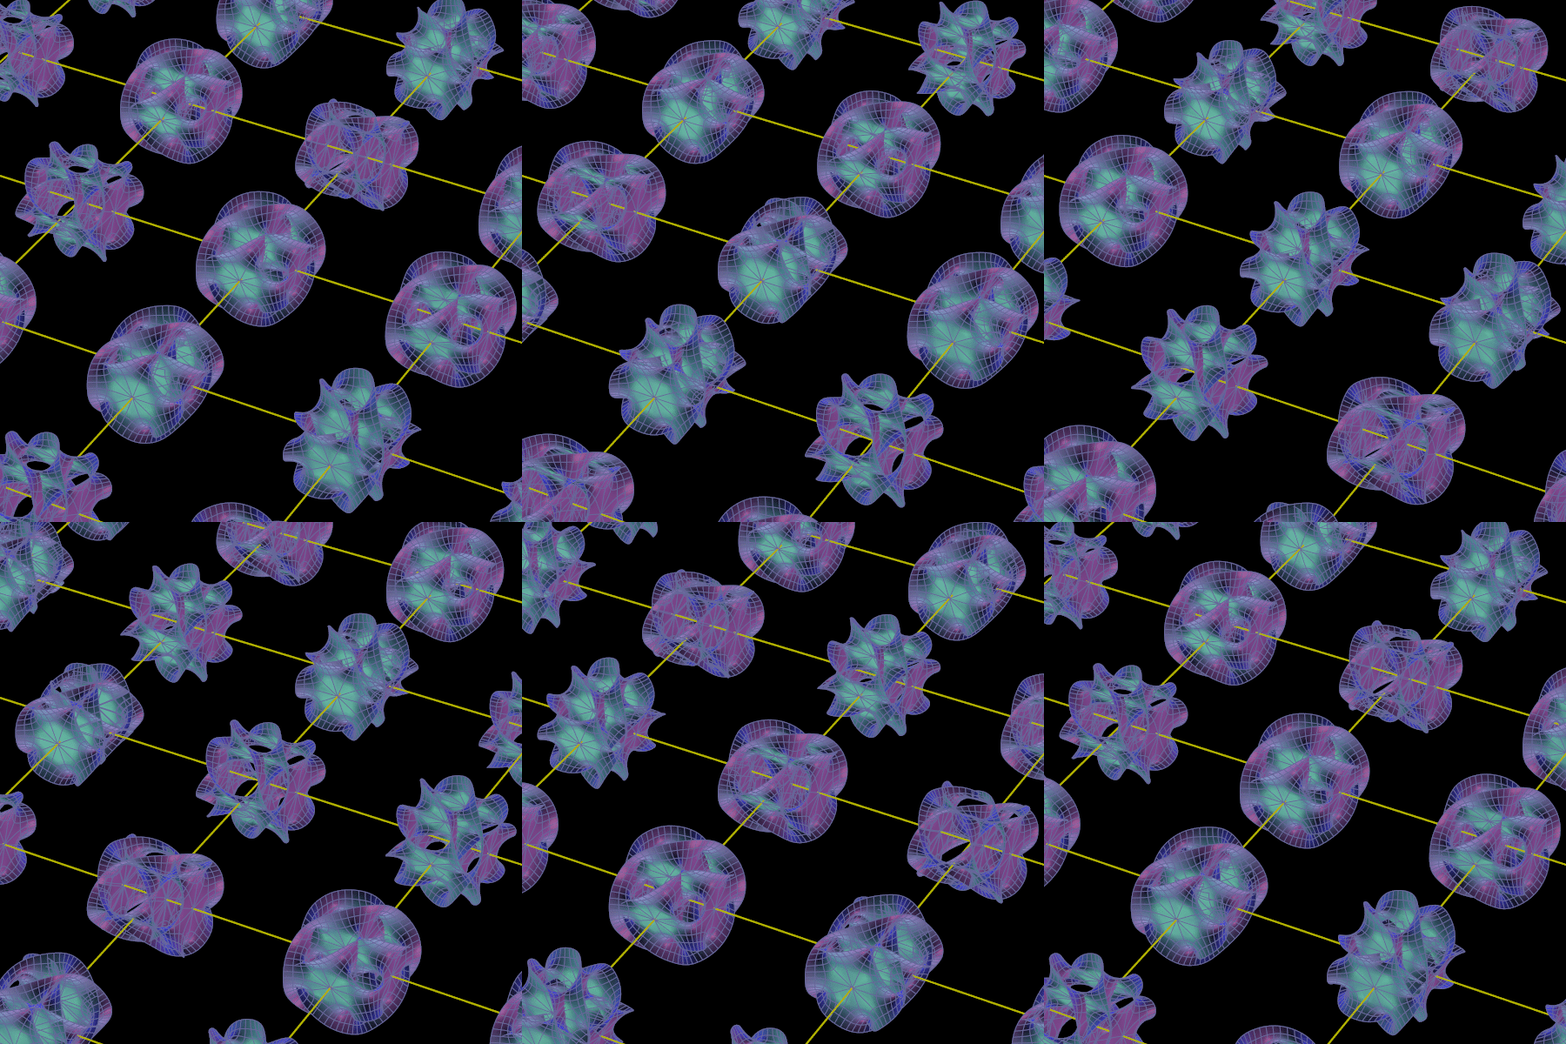
FIGURE 1: Quantum foam model for the fabric of space at very short lengths. In this diagram, the vacuum of space is represented by three successively smaller lengths which are magnified as we go from top to bottom. The bottom strip is a length equal to 10-33 centimeters which has been enlarged so that the suspected quantum foam structure of the vacuum is visible. A somewhat different picture for the structure of the vacuum emerges from string theory. There, the fabric of space is thought to consist of tiny balls of rolled up extra dimensions, called Calabi-Yau shapes, something like that shown in Figure 2. There the length scale is approximately the same as in the bottom strip of Figure 1.
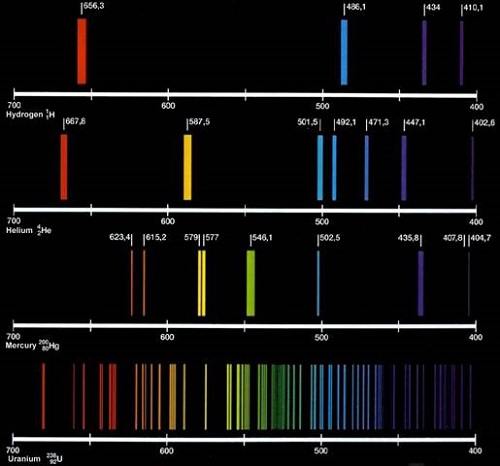
FIGURE 2: Rolled-up balls of extra dimensions (Calabi-Yau shapes) making up the fabric of space. No matter how the fabric of space is actually structured, the energy which was invested in this fabric was a kind of potential energy. It manifested as the smallest particle that our universe is capable of producing: positively and negatively charged Planck Particle Pairs (PPP). In order to understand the sizes involved, let us make a comparison. If an electron were the size of the Golden Gate Bridge, a Planck Particle would be smaller than a grain of dust on that bridge. These particles were initially postulated by Planck early in the 20th century. However they were not studied seriously until fifty years later. A lot of recent work has been done by Gibson and Daywitt. The evidence for their previous existence is a sort of 'fogginess' which exists everywhere we look at the farthest reaches of space. In the same way our atmosphere causes the stars to twinkle, the PPP 'fog' causes the distant quasars to 'twinkle.' The initial expansion of the cosmos fed energy into the fabric of space as PPP. How did this happen? If we recall Einstein's famous equation, E = mc2, we recall that energy and matter are interconvertible. The energy invested in the stretching itself was manifested as these tiny particles. Since Planck Particles came in pairs; one positively charged, the other negatively charged, space itself remained electrically neutral. As the stretching continued, more and more PPP were formed. In addition, because of the expansion, the separations between various PPP changed, resulting in turbulence. Gibson has shown that while any turbulence exists, more PPP will form by feeding off the energy of the turbulence. The origin of the Zero Point Energy The separation of electric charges gives rise to electric fields. Magnetic fields are generated by the turbulence of the PPP whirling about each other. Furthermore, since these particles are either positively or negatively charged, they will have the tendency to recombine and thus annihiliate as a pair. When this happens, both the instrinsic energy of the particles themselves as well as the energy of their motion is released as electromagnetic waves. When the expansion ceased, the turbulence took time to die down, so more PPP were formed until the turbulence was finished. The recombination of the Planck Particle Pairs then continued until all PPP were annihilated. In this way, all the energy that originally went into the expansion of the universe itself was then converted into electromagnetic waves of all wavelengths. These waves are considered intrinsic to the fabric of space. This energy has been detected and investigated. If a sealed flask is emptied of all physical particles and then cooled to absolute zero, this energy is still present. For this reason it is called the Zero Point Energy (ZPE). Thus the Planck Particle Pairs were the intermediates between the enormous potential energy invested in the fabric of space to begin with and the final conversion of that energy into the kinetic energy of the ZPE. Two points should now be noted. First, the Zero Point Energy continues at a relatively constant level. It is maintained by a feedback mechanism which has been the subject of research by a number of physicists. Second, once all Planck Particle Pairs had recombined and the ZPE built to its maximum level, the ZPE strength was then subject to an oscillation. As shown by Narliker and Arp, the universe itself need no longer be expanding, and is stable against collapse, as long as it has matter in it and can oscillate a bit in size. This is what we see, and the measurements of a number of 'atomic constants' reflect this. When the universe is at its minimum size, the ZPE is contained in a smaller volume, and its energy density or strength will be at a maximum. However, when the universe is at its maximum size, the ZPE strength will be at a minimum. Because the universal oscillation occurs in several modes simultaneously, the graph of ZPE strength may have flat points as well as variable maxima and minima. A full discussion about the ZPE, its origin, and the ZPE-dependent data which verify this oscillation, can all be found in "Reviewing the Zero Point Energy." The ZPE-dependent data support Narliker and Arp’s contention that we are living in a slightly oscillating, but basically static, universe. Introducing the initial plasma Students around the world are familiar with the concept that the universe began as a relatively small object at a temperature of about 10 billion degrees Kelvin or more. At such temperatures, all matter is in the form of plasma. This means that no atomic structures existed. Only a swirling mass of independent negatively charged electrons, positively charged protons and nuclei (ions), along with neutrons, existed. In such plasma, light and all electromagnetic radiation is scattered by the electrons and ions. As a result, the plasma acts in the same way as does a fog through which no light can penetrate. Indeed, the light photons and the ions and electrons intrinsically interact with each other in such a manner that the speed of sound in such plasma is 57% of the speed of light. Matter and electromagnetic radiation are then said to be “coupled”. In this state, plasma reacts strongly to electric and magnetic fields as well as to sound waves. The data indicate this superhot plasma was expanded out rapidly. This is in accord with the Bible which states 12 times that the Lord created the heavens and stretched them out. This statement is in the past tense and always in the context of Creation Week. The implication is that, after the initial expansion, the universe became more or less static. The research of Narlikar and Arp indicates that a static cosmos, which contains matter, would be stable against collapse; however it would oscillate slightly in a variety of modes. This becomes important later, but for now the initial expansion captures our immediate interest. As stated above, the original super-heated state of the expanding universe required the initial substance to exist as a plasma. It can also be stated that, quite independently of temperature considerations, an understanding of the action of the ZPE in the early universe requires that the initial form of matter must have been plasma. This is because a significant ZPE strength is needed to allow atoms to form. For an atom to form from dissociated electrons and nuclei, the electrons must be captured and held in stable positions relative to the nucleus, creating a neutral atom. Hall Puthoff and other scientists have explained this. Puthoff demonstrated in the linked 1987 paper that atomic orbits only exist because of the presence of the ZPE. A fuller discussion of this appears in the 2007 Setterfield paper “Reviewing the Zero Point Energy” In other words, when there is no ZPE, or only a very low ZPE, neutral atoms cannot exist. It was only after the ZPE had built up to a significant level that electrons would be able to settle into their known positions around nuclei. As a consequence, it was only then that neutral atoms would form out of the plasma. Prior to this there was only plasma, a surging mass of electrons, protons, neutrons and atomic nuclei or ions. Puthoff and others have demonstrated that the Zero Point Energy is necessary to maintain stable atomic orbits. Therefore, it would hold that any increase in the ZPE would be reflected in the increased energy of these orbits. This has a direct affect on the light an atom produces. Any element can produce light. A photon of light is released when an electron which has been forced out of its normal position snaps back, releasing the energy that forced it out. Thus, the more energetic the electron's orbit, the more energy is required to force it out of that orbit and this means that same increased amount of energy is released when it snaps back. Since the red end of the light spectrum is the low energy end, a lower ZPE in the past will mean that redder light would have been produced then. This is what is observed astronomically. The further out into space we look (and hence the further back in time), the further down towards the red end of the rainbow spectrum the emitted light is shifted. This effect is known as the redshift. Since the Zero Point Energy is uniform throughout space, its effects on the atoms will be uniform at any one time. It has been shown that an increasing ZPE strength will mean that atoms will emit more energetic light with time uniformly throughout the cosmos. The Zero Point Energy and the Redshift Red shift measurements can be made regarding any element. Any element can produce light when its electrons are disturbed. Each element's light, however, is slightly different when analyzed. Think of the bar codes we see on products -- a series of heavy lines, light lines, and spaces. Each element has a signature 'bar code' which identifies it. Here on earth, we have a laboratory standard for each element. These 'bar codes' extend across the rainbow of colors.
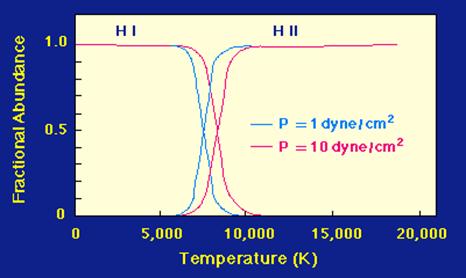
However, as we go out in space, something called 'the red shift' is seen. The familiar bar code for any given element is shifted toward the red end of the spectrum a bit. Then, when we go further out, it is shifted more. It will be the same bar code from the same element, but at a different place on the color spectrum. In the 1920's Hubble considered the possibility that this shifting of the light was due to something called a Doppler Shift. Although he expressed doubts about his explanation later, it was adopted by the scientific community. A Doppler Shift can be experienced in our daily lives when an ambulance or fire engine or police car passes us. If the siren is going, we hear the sound of the siren coming towards us at a steady pitch, but as the vehicle passes, the pitch suddenly drops. This change in pitch is caused by the sudden lengthening of the sound waves themselves as the vehicle races away from us. For this reason, it has been considered that the red shift we see 'out there' is indicative of an ever-expanding universe. However, repeated series of measurements by a number of astronomers indicate that the redshift measurements do not occur as a smoothly progressing series. Rather, as we look out past our local group of galaxies, the red shift measurement is steady until it takes a sudden jump to 'higher' value, which is actually a lower level of energy. This pattern repeats itself in a steps and stairs fashion as we proceed further out into the universe. This quantization, as it is called, indicates that the redshift cannot be due to an expanding universe, in the sense of being a Doppler shift. The universe could not be expanding in fits and starts. In some cases the redshift jumps go right through galaxies. If it was due to motion, those galaxies should show disruption, but they do not. In addition, William Tifft, the astronomer who first noted the quantization, has shown that some galaxies have had their redshift become less (that is bluer) by one quantum jump over time. These features cannot be explained by galaxy motion or ongoing universal expansion, but are perfectly explicable in terms of a ZPE increasing with time. Since we can see the redshift back to the frontiers of the cosmos, this means we can see back to the earliest days of the universe. The redshift therefore provides data giving ZPE behavior back to the origin of the cosmos. This can be cross-checked since the mathematical curve that the ZPE has followed with its build-up over time can be established from the known behavior of systems undergoing turbulence and recombination. When this is done, the result is that theory and data agree. It is discussed in detail with the references in a paper published in December 2008 entitled “Quantized Redshifts and the Zero Point Energy.” (and its correction in the appendix to this paper). In other words the mathematical equation that the ZPE strength has followed as it has increased with time can be theoretically derived and checked from the observations of the redshift. Since light becomes more energetic, and thus bluer, as we approach the present, this indicates the ZPE strength has increased through time. This means the redshift has lessened. Thus, the redshift/distance equation is the inverse of the ZPE/time equation. The data and analysis indicate that redshift equation reads as follows: (1 + z) = (1 + x) / [√(1 – x2)] (1) Here, the redshift is z, and distance is x. Note that in this equation, distance, x, is a dimensionless number which goes from zero (0) in our Local Group of galaxies to one (1) at the furthest distance in space, which effectively marks the origin of the cosmos. In other words, x gives the position of any galaxy as a fraction of the total distance. This procedure is used by astronomers to overcome problems with determining an absolute distance scale. In a similar fashion, the strength of the ZPE, U, can be expressed as U = [√(1 – T2)] / (1 + T) (2) Again, in equation (2), T is the fraction of the total time. Note that T follows the distance x, and so may be interchanged with it, since as we look out further and further in astronomical distance, we are also looking back in time. The result is that orbital time T = 0 near our own locality in space and T = 1 at the origin of the cosmos. Therefore, as outlined in the 2007 paper“Reviewing the Zero Point Energy”we can write equation (1) in the following form (1 + z) = (1 + T) / [√(1 – T2)] (3) We will return to this aspect of the topic a little later, because one of our aims is to determine the total length of time over which these equations were operational. In other words, we must find out what value in orbital years makes up the denominator of T in all these fractions. This will then give us the total time it took the ZPE to build up to its maximum value and for the redshift changes to occur. We are assisted in this because both T and x can be found from the redshift z since the following equation is satisfied. x = T = z(z + 2) / (z2 + 2z + 2) (4) Verification of this relationship can be obtained by substituting for x or T in equation (1) or (3). As the universe expanded, it cooled and the PPP built up the Zero Point Energy. How the plasma behaved during this time is important. There was a point at which the ZPE had built up enough to cause the formation of neutral atoms. The important moment for our purpose here is the one in which neutral atoms began to predominate. Since the predominant element in the universe is hydrogen, comprising some 80% of the total, a consideration of what occurs with hydrogen will approximate to the effects on all elements. The temperature at which hydrogen changes from an ionized gas, or plasma, to a neutral atom, or the point at which heat causes it to reverse that process and become ionized again, becoming plasma, needs examination. Hydrogen in our atmosphere, as we know it, is in the form of neutral atoms or molecules. As we heat it, we find it stays neutral for a long time. At about 3000K, the molecules separate into single atoms. However at 5000 degrees Kelvin nearly all hydrogen is still in the form of neutral atoms. But, by 5800 K, a significant portion has become ionized. So the average temperature where the change-over from atoms to ions (plasma) occurs is about 5400 Kelvin. This change-over also applies to the reverse process, namely cooling from a high temperature plasma. Therefore, by 5400 K, a significant number of the ions will have become neutral atoms. This is shown graphically in Figure 3 below. There, the symbols H I on the top left refer to neutral atomic hydrogen and H II on the top right to ionized hydrogen (plasma). Pressure also plays a minor role here as shown by the colored lines. The red lines give the results for a pressure that is ten times that of the blue lines.
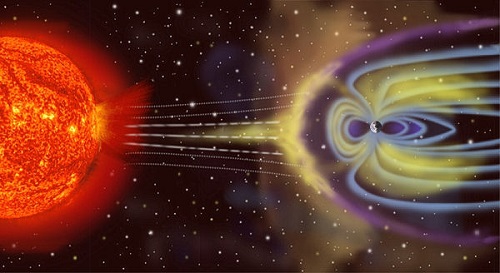
FIGURE 3: Hydrogen ionization or recombination temperature In the scenario under consideration here, the strength of the ZPE is important because neutral atoms cannot form until the ZPE has built up to a significant level. Once this level has been reached, neutral atoms can form throughout the plasma. At that point the formation of neutral atoms itself contributes to the plasma temperature dropping to 5400 K. Once the electrons have achieved their proper position, the temperature of the ion itself drops. In the early plasma, light photons were released by the interactions of electrons with free nuclei. Before the neutral atoms were formed, however, the plasma was acting in the manner of a fog, not allowing the light out. The light was simply scattered within the plasma itself. But when the ions began forming into neutral atoms, there was a change. Once neutral atoms were predominant, and most electrons had become associated with atoms, light was no longer scattering as before. The plasma had become transparent to light. At this point, radiation is said to be “de-coupled” from matter. An excellent diagram showing this idea may be found here. About a quarter of the way down the page is the diagram of what happens to light when the plasma ions recombine to form neutral atoms. Plasma physics experiments indicate that even if only 1% of atoms in a gas are ionized, the gas will still behave as a fully ionized plasma and respond to electric and magnetic fields accordingly. So even after the moment of decoupling, the matter making up the universe was still responding to electric and magnetic fields in the same way that fully ionized plasma will. Indeed, it has been shown by radio astronomer Gerrit Verschuur that so-called “neutral hydrogen” clouds in our galaxy, where ionization is only about one part in ten thousand, are still behaving as plasma and are still associated with the strong electric currents and magnetic fields usually associated with plasma. The origin of the Cosmic Microwave Background Radiation At the moment decoupling occured and there was neutral atom formation in the original plasma, light started to stream through. The plasma was now transparent. This event is entirely dependent upon the instant that the strength of the ZPE had reached the critical threshold needed for atom formation to begin. Astronomically, when we look very far out, or back in time, it is like looking back at a bank of fog with a temperature of 5400 K. This bank of fog is known astronomically as the Cosmic Microwave Background Radiation or CMBR. The CMBR comes to us uniformly from all parts of the cosmos. In the early twentieth century Einstein had declared there was no absolute frame of reference in the universe regarding speed or position. Things could only be compared in position or velocity with each other. This gave rise to his theories of relativity. However, with the discovery of the CMBR, we had a frame of reference that was absolute. That is because the temperature at the edge of this 'fog bank' was uniform. Thus objects could be compared in position and speed to that temperature base. The CMBR provides an absolute frame of reference for any and all velocities.
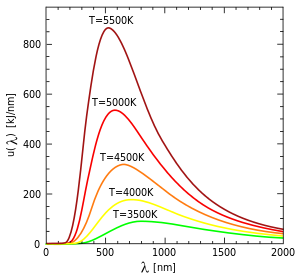
There is something called black body radiation which needs to be explained at this point. "Blackbody radiation [is] the electromagnetic radiation that would be radiated from an ideal black body; the distribution of energy in the radiated spectrum of a black body depends only on temperature and is determined by Planck's radiation law." A black body is one which is capable of absorbing all electromagnetic radiation at all wavelengths. When this body is warmer than its surroundings, it will emit thermal radiation. The heat of that radiation produces a distinctive curve which is associated with that particular temperature.
Investigation reveals that the Cosmic Microwave Background Radiation (CMBR) is coming to us with the same profile of wavelengths as a black body at a temperature of 2.725 degrees Kelvin. However, when we look at the temperature at which hydrogen ions become neutral atoms, we see its actual temperature was about 5400 K. The reason for the apparent temperature difference is the ZPE. A lower ZPE means longer wavelengths, whether in visible light or any other part of the electromagnetic spectrum. As a result, the term 'red shift' will apply to all parts of the spectrum, not just the parts we can see. The diagrams linked below are quite good to show what happened and what we see. However the diagram to the left gives the point at which the 'last scattering' occured (when the plasma became primarily neutral atoms) as 2970K. Actual experiments with hydrogen put the temperature much higher, as we have noted. Returning to the same lecture linked above, the appearance of the CMBR background is well illustrated in the picture just below the one referenced above. With a low ZPE, atoms were less energetic, and so their emitted temperature radiation had longer wavelengths than the same temperature has today. In other words, the temperature radiation coming to us from that time has been redshifted as in equations (1) and (3). Their actual redshift, z, is given by the ratio of the temperatures, namely z = 5400/2.725 = 1981 (5) This number, 1981, when inserted in the red shift equation (4) for 'z' the red shift, we can find out what the time is, or T, when the CMBR was formed. It was at this moment in time that the plasma became transparent and light was no longer trapped inside it, but could shine out. When we do this, here is the result we get for that moment in time. Remember that time at the beginning is "1" and time when the ZPE came to its maximum and the red shift function ended is "0." T = 0.999999490877 (6) This means that the point at which the light started shining was extremely close to the very beginning, but not quite there. If we subtract this number from the absolute beginning, when T=1, we get (1 – T) = 0.000000509123 (7) The clearing of the fog of the CMBR represents the first time that light could shine out of the plasma. According to Scripture, this event occurred at the half-day mark of the first day in orbital time during Creation Week. That would be the time when the CMBR originated. If we divide 0.5 (half a day) by the number of days in a year (365.25), then we find that half a day is equal to 0.0013689 of that year. Now half a day in one year is equal to 0.0013689 of that year. The figure in (7) above shows how much of the time the red shift was in operation before the CMBR appeared -- a very small fraction of the total time. If this is the half-day mark as indicated by the Bible, we can then measure the total length of orbital time that the redshift function, z, was operating. The calculation goes as follows: If ½ Day in 1 year = 0.0013689 Look again at equation (5). It is not the Bible which has given us this data, but science. This means that 2688 years is how long, from the beginning of creation, that the Zero Point Enery was building (before the oscillation we experience now took over), causing the red shift to operate. Thus the redshift equation covers a period of 2688 years from the time of creation (where T equals one) right up to the occasion when T equals zero. Therefore the denominator of the fraction representing T will always be 2688 years. Once the redshift function ends (which, in space, corresponds with outside of our local group of galaxies), the oscillation in ZPE strength assumes the key role. This ZPE oscillation comes from the various modes of oscillation of the universe, as mentioned above. These oscillations therefore dictate the form of the curve from the close of the redshift function right up to the present. This will be discussed in more detail below. However, other important effects of ZPE behavior now demand our attention. The Zero Point Energy and atomic constants In the September 2007 article “Reviewing the Zero Point Energy," it was shown that, as the ZPE increased, a number of atomic processes were affected. These were in addition to atomic orbit energies which were discussed in more detail in the December 2008 paper “Quantized Redshifts and the Zero Point Energy.” These papers explain how an increasing ZPE strength, U, is the root cause for
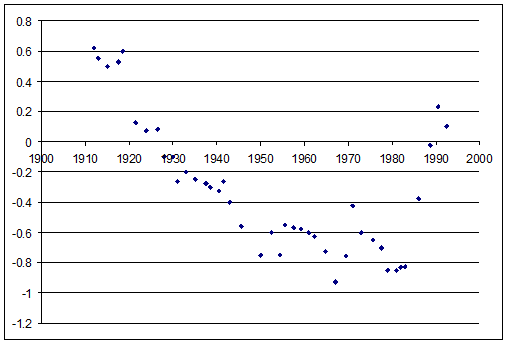
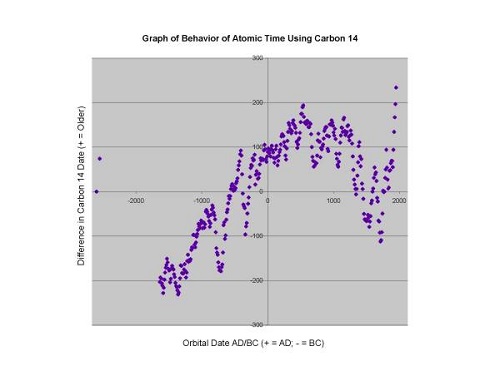
When the Zero Point Energy was lower atomic processes were faster. One reason for this is because the less battering by the ZPE the subatomic particles were subject to, the more quickly they moved in relation to one another This battering effect had another consequence, too. Subatomic particle masses are measured by seeing how much space a particle takes up. The more violent the battering, the more space they take up, and the greater the effective mass. The greater the mass, the slower their movement in relation to each other. This means, in short, that atomic processes were much faster in the past. Thus, atomic time was faster long ago and then slowed down dramatically during the time the ZPE was building up. Since then there has been the aforementioned oscillation. The most recent change in measurement directions occurred in 1970. In other words, the length of time, t, between ticks on atomic clocks gets longer as the ZPE increases. When the ZPE strength was lower, atomic clocks ticked faster. In the above published papers, these basic relationships are shown to be mathematically expressed in the following form 1/ U ~ 1/ h ~ 1 / √m ~ 1/ t ~ c ~ (1 + z) = (1 + T) / [ √ (1 – T2)] (9) where the symbol ~ means “proportional to” in this paper. In contrast to these ZPE dependent constants, it has been shown in the above published papers that the time taken for the earth to orbit the sun remains unchanged regardless of ZPE variation. In a similar way, the orbit times of other astronomical objects also remain fixed. Figure 4 below shows how the atomic clock has behaved compared with orbital clocks when the data for the planet Mercury is considered.
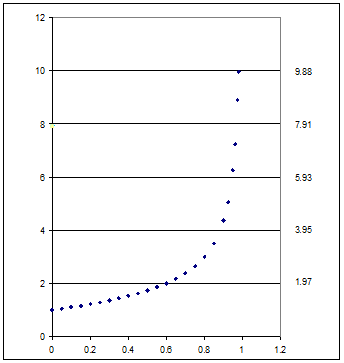
Figure 4: Graph of atomic clock behavior compared with the orbital clock for Mercury. Similar data plots have also been made for other planets. The data show that the atomic clock was slowing up until 1970, when a change in direction occurred. This change in trend direction about that time has also been noted for Planck’s constant, h, atomic masses, m, and the speed of light, c. as graphed in “Reviewing the Zero Point Energy". This change in trend direction for the atomic constants is reflecting a change in direction of the universal oscillation about 1970. As such the data are confirming that Narliker and Arp’s model of universal oscillation is correct. A graph of the function in equation (9) is given in Figure 5 below. There the orbital time fraction, T, is given on the horizontal axis with T = 0 near our current epoch on the left and T = 1 at the origin of the universe on the right. The value of the redshift (1 + z) is given on the vertical axis on the left.
Figure 5: Graph of the behavior of the quantities in equation (9) with (1 + z) vertically on the left. From this relationship in (9), it can be shown that the years elapsed on the atomic clock, te or its equivalent, namely the distance in light years that light has travelled, is then given by substituting for T in the mathematical integral of (9) which is formulated as follows: te = K* [(arcsin T) - √ (1 – T2) + 1] (10) In this equation, we can put in the atomic time which has elapsed (te) and find the orbital time which it corresponds to (T). Conversely, we can put in the orbital time (T) which has elapsed, and find the atomic time it corresponds to (te). The final term of unity (the numeral 1) in (10) is included since this gives te = 0 when T = 0 . This gives them both the same starting point -- creation/the inception of the universe. This means when T = 1, te will give us the maximum possible atomic date for the beginning of the universe. At the origin of the cosmos, when T = 1, the terms within the square brackets in (10) total 2.5707. This is the maximum possible value for terms in the square brackets (which are concerned with orbital time). When this is multiplied by K*, we can find the corresponding atomic time. K* is the conversion factor, and it is this we must look for now. In order to find K*, we need to know the age of our Galaxy. From the principles of plasma physics and the ZPE, as discussed in Reviewing a Plasma Universe with Zero Point Energy, knowing the age of our own galaxy will also give us a very close estimate of the age of the universe. First of all, it is important to remember that, contrary to the data presented above, science today considers atomic ages to be exactly the same as orbital ages. Using this presupposition, the age of our galaxy is normally determined by looking at the metal content of stars (which can be determined from their light spectrums) and then determining, theoretically, how these metals were produced. The theory, which is called the theory of nucleo-synthesis in stars, states that nuclear processes, such as fusion, create the various metals. However there are different theoretical models, and it is the model used which determines the age one comes up with. So the dating process for our galaxy, and the universe is very model-dependent and, as such, is somewhat unreliable. (This does not even take into account the difference between atomic and orbital time.) There has only been one published atomic age-determination which is completely independent of the problem of nucleo-synthesis model-dependency. This method of determination gives the age of our Galaxy, and hence the age of the universe, as being 12.3 +/- 3.6 billion (or 12 x 109 +/- 3.6 ) atomic years [Extinct Radioactivities in the Early Solar System and the Mean Age of the Galaxy]. Some model-dependent assessments also come close to that atomic date. Let us therefore adopt a maximum elapsed time, te, in equation (10) as being 12.3 billion atomic years. Since this is the maximum age which applies when T = 1, and since the terms in square brackets in (10) will total 2.5707. We then have the following equation: te = 12.3 x 109 = 2.5707 K* so that K* = 4.7846 x 10⁹ (11) Note also that since the time-base for T (the total elapsed orbital time for the red shift function, as derived in equation 8) is equal to 2688 years, then if we divide the conversion factor, K* by the total elapsed orbital time, 2688, we get K -- the factor that gives us the rate of ticking of the atomic clock at the end of the red shift curve. This means K* = 2688 K so that K = 1.780 x 10⁶ (12) Here in (12), it should be noted that, since the time-base is given as 2688 orbital years, then the quantity K assumes some importance. It can be shown that it is the physical constant needed in (9) to change the equation from a mere proportionality to an exact equality for speed of atomic processes -- and thus the rate of 'ticking' of the atomic clock -- for any given value of T. Remember that the Zero Point Energy is the cause of a number of effects, the speed of light being one of them. The rate of 'ticking' of the atomic clock and the speed of light move in sync with one another, so the ratios of the two from any given point in time to any other given point in time are exactly the same. (references for data on the changing speed of light can be found here and here and here.) For the next part there is a difficult way refer to the speed of light and an easier way. The speed of light now is 299,792.458 km/second. At some certain point of time in the past, the speed of light was a million times faster than now. If we want to find the ratio, then we divide the past by the present: 299,792,458,000 / 299,792.458 That's awkward. If we reduce it, we get 1,000,000 / 1. In the following equation, then, the 'c*' represents how much faster c was in the past than c is now. This is not necessarily one million times. The value of c* will be derived from the equation itself, and will depend on what values are put in for the time (T) and the redshift value (z). Since the ratio of the speed of light is the same as the ratio of atomic processes when two different points in time are considered, we then get c* = K (1 + z) = K (1 + T) / [ √ (1 – T2)] (13) In a similar way, since the atomic clock ticks twice as fast when the speed of light is twice its present value, then a similar equation can be made for t (atomic time). The necessary calibration information is now given to us from (11), (12) and (13). Substitution in equation (10) then gives us elapsed atomic time, te, or the distance travelled in light years. So (10) now reads te = 4.7846 x 10⁹ [(arcsin T) - √ (1 – T2) + 1] (14) This is, then, the equation which allows us to convert any given atomic time to an orbital time, or conversely, any orbital time to an atomic time. This equation is good for the time starting with creation/the inception of the universe to the point at which the Zero Point Energy had finished building. That amount of time, orbitally, is 2688 years. The atomic time is, of course, much different -- about 12.3 billion years! Later, the dates will be converted to find out if atomic dates and orbital dates can actually mesh where known events are concerned. But first, back to the beginning.
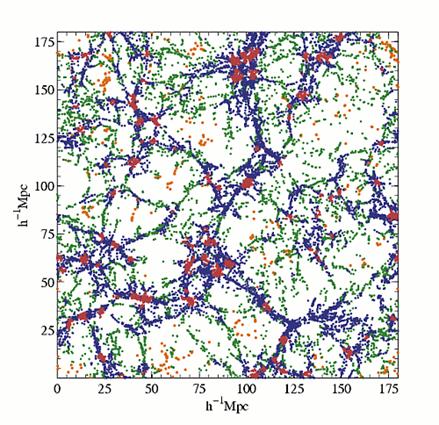
III. FORMING A PLASMA UNIVERSE On the ZPE – Plasma Model presented here, there was an initial rapid expansion of the cosmos out to its maximum size. The data indicate that at this point an oscillation took over. Interestingly, at the time the red shift function ceased, there was a rather sudden drop in the speed of light. This may have been due to a bit of relaxation occuring in the stretched universe itself, which would have caused the ZPE to become more dense, or it could have been that the oscillation had been going on the entire time and at the point the red shift function stopped, we were simply in a contraction mode. There is a short amount of time -- perhaps about two hundred years -- during which data is not available. But what we do see is a lower speed of light after this gap than before, when the red shift function ended. After this, the universe came to a position of stability in its oscillation. The contraction which occurred during that 'gap' time increased the strength of the ZPE further, lowered atomic clock rates, and brought about a further, but much slower, decline in the speed of light. The oscillation itself has produced various maximums and minimums in atomic processes as the density of the ZPE changed in response to the oscillations. The oscillation will be discussed more fully later in this paper. As has been shown above, all matter in the universe began as plasma. This is indicated by both temperature considerations and because of the initial low strength of the ZPE. According to Big Bang modeling, the universe was initially filled with a sea of protons, neutrons and electrons in a composition that finally resulted in the formation of about 77% hydrogen and 23% helium. In that model, all other elements are then formed by nuclear fusion processes inside stars that eventually became supernovae. The elements that were synthesized by this process inside stars were then exploded into space where they eventually mixed with other gas clouds and became incorporated into later generations of stars and planets. Big Bang proponents admit a major problem with this scenario: the time factor. It takes time for massive stars to build up these elements within them and explode them out into space. It takes time for these explosion remnants to be incorporated into a new generation of stars. This time is far too long on the Big Bang model because, at the earliest moments in the universe, we see elements such as iron and magnesium present in the gas around very ancient quasars. There is another problem as well, which comes into play before the formation of the elements. It has to do with the proposed formation of the earliest stars which Big Bang proponents say formed those elements. They need to get a gas cloud to contract enough to form a star. As a gas cloud contracts, it heats up, and heating causes expansion. The way BB proponents overcome this problem is to say that complex molecules radiate the heat away in the infrared range, thereby overcoming the heating problem presented by a contracting gas cloud. The problem there is that they need those complex molecules to form. That means they need more elements than hydrogen and helium to exist to form those complex molecules. So where did THOSE elements come from? This leads to another basic problem with the Big Bang model. Quasars from the earliest epochs with redshifts greater than z = 6.5 show the same iron abundance as we see in our galaxy [see Nature 483 (3 November 2005), pp.45-50, and Astrophysical Journal 515 (1999) pp. 487-496]. Furthermore, stars in these distant galaxies all show the same metal enrichment as we see in our own galaxy today. A number of other observers have noted this same problem. This indicates that all the elements up to iron (and probably the rest of the Periodic Table) were already in existence in their present abundances when the quasars and early stars were in existence. The Big Bang model and the standard gravitational explanations cannot account for this. (see “Astronomers Get Burst of Details from Early Universe,” “Is the Universe Older than Expected?”etc.) The creation models currently accepted by the major creationist organizations try to deal with much of this by stating that perhaps the universe was created fully formed with light already in transit, or perhaps distances are not what they are measured as being. Other than accepting creation itself as being at the hand of God, there is no apparent effort to deal with the data astronomically. Perhaps it’s time to consider the option of plasma physics more seriously. The problem of early elemental abundances does not exist when plasma physics is considered. Fusion occurs readily in plasma filaments under easily reproducible conditions, with no restriction on which elements may be formed [see D E Scott, “The Electric Sky,” pp. 105-107, Mikamar Publishing, Portland, Oregon,2006]. While the Big Bang model requires the formation of stars to produce other elements, this is not necessary when considering the actions of plasma filaments. Since the process in these filaments is rapid, elements are formed quickly enough to be found in the first quasars and stars. There is also another possibility suggested by Ed Boudreaux, Emeritus Professor of Chemistry at University of New Orleans, Louisiana. After an extensive and rigorous series of calculations, he has pointed out in several conference presentations since 2003 that, if the original plasma was at 10 billion to 20 billion degrees, then all the elements could be produced in their known abundances in as little 30 minutes. The only proviso was that the plasma composition was such that the ratio of protons, neutrons, electrons and ions was the same as that found in water. In other words, the creation of the elements could easily have come from a plasma whose composition was basically the same as water. This is exactly in line with the account in Genesis. So two possibilities exist: one from known plasma physics experiments, the other from theory and calculation. On this basis it can be stated that in the earliest moments of the universe, all the elements could have been formed in a manner that did not require nuclear-synthesis inside massive stars. It should be mentioned that there are other researchers who have come to the same conclusion: that there had to be atomic nuclei greater than mass 5, as well as the protons and electrons making up hydrogen, in the first moments of the universe. Wigner has proposed it was carbon nuclei; Boudreaux has proposed oxygen nuclei. The reasons making the additional nuclei necessary tend to be too complex for this article but may be referenced in a number of other places, even as early as George Gamow’s The Creation of the Universe (New American Library, 1960). More information from the CMBR (cosmic microwave background radiation) Earlier in this article we discussed the expansion of the universe and the resulting formation of the vacuum Zero Point Energy (ZPE). As the ZPE built up, we noted that, at a critical point in this process, the cosmic microwave background radiation (CMBR) was produced. Research on the CMB radiation indicates it contains patterns that have been formed by sound waves. See, for example, the paper by C L Bennett et al. in Astrophysical Journal Supplement Series 148 [1]: 1-27, 175-194, September 2003. In plasma, sound waves cause electrons, protons and ions to move. This movement of charged particles creates electric currents. These currents become confined by their secondary, circumferential, magnetic fields. As a result, spaghetti-like filaments are formed. This process has been observed in laboratories where both sound volume and wavelength were shown to be important [see R W P McWhirter and R Wilson, Journal of Physics B: Atomic and Molecular Physics, 7:12 (1974), pp.1588 ff]. Evidence indicates these sound waves formed filaments and voids in the plasma. The patterns formed in the CMBR have been shown to be the precursors of the observed patterns of filaments and voids formed by galaxies and clusters of galaxies (see, for example “State of the Universe” by Ron Cowen in Science News, March 15, 2008; “Evidence Reported for Acoustic Oscillations in Early Universe” in Space Daily, May 24, 2001, “Vibrations of the Cosmic Drumhead,” in L’Observatoire de Paris, etc.) . The large-scale filamentary structure of the universe is shown in Figure 8 below which is a plot of actual galaxy and galaxy cluster positions.
Figure 8: Plot of galaxy and galaxy cluster positions showing filaments and voids These filaments and voids are excellent evidence that the universe has been formed by the action of plasma physics. Indeed, one of the plasma physics pioneers, Hannes Alfvén, predicted in 1963 that the large scale structure of the universe would be found to be filamentary. To the amazement of astronomers, this was proven to be correct in 1991. The reason for the amazement was that these structures cannot be formed by normal gravitational interaction. Thus astrophysicists had invented things like ‘dark matter’ which are meant to solve the gravitational problem. The ‘dark matter,’ whose existence has yet to be shown, must be very finely tuned. Indeed, the whole gravitational scenario for the formation of galaxies, stars and planets has had serious and ongoing problems. For this reason, astronomer James Trefil titled one article “Five Reasons Why Galaxies Can’t Exist” [The Dark Side of the Universe, pp.55-66, Doubleday, New York, 1989]. He has recently indicated to his students that these problems still exist with the gravitational scenario [private communication, summer 2007]. For this reason, the plasma alternative is more viable since it operates by electric and magnetic forces. In plasma, electromagnetic forces can exceed gravitational forces by a factor of 1039. Even in neutral hydrogen regions of space where the ionization is as low as one part in 10,000, electromagnetic attraction is still 107 times stronger than gravity [A L Peratt, Physics of the Plasma Universe, p.17, Springer-Verlag, New York, 1992]. This is the strength of forces acting in plasma filaments and filamentary structures. These filamentary structures must have formed rapidly for the following reasons:
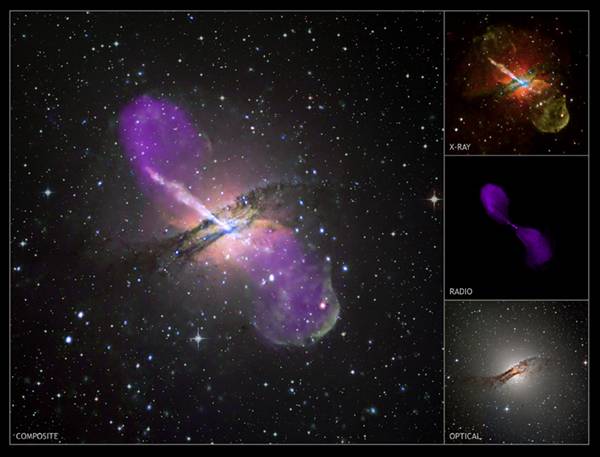
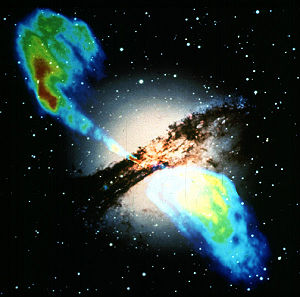
This means that structure had to be in place before the origin of the CMBR signals themselves. Therefore, the basic pattern must have formed before the 12 hour mark on Day One during Creation Week, since that is when the fog-bank of the CMBR cleared, allowing light to be seen. It is possible from the above equations to calculate the speed of light at any moment during Creation Week, as well as afterwards. If we allow half an hour or so for the elements to form, and assume that the filaments started to form shortly after that, then we have the speed of light at that point as being 1.728 x 10¹⁰ times its current speed. The speed of sound in this plasma was then 57% of that speed or 8.64 x 10⁹ c (now). Therefore, in half a day, or a period of about 12 hours, all sound waves would have travelled a distance of close to 12 million light years, no matter what their point of origin was. This means that when the universe was only a few hours old it could still be up to 24 million light years in diameter. Despite this size, and due to the speed of sound at the time, sound from its periphery could penetrate to the center before the CMBR formed. In fact, early in creation, the actual dimensions of the cosmos were probably considerably smaller than that, since the expansion process was still continuing. This means that the distances between filaments were also much smaller. In addition, the effect of sound waves on the plasma filaments probably did not end half way through Day One, but continued on as the cosmos was being expanded. As a result, the whole filamentary structure would become stretched out, and the electric and magnetic interactions would be proportionally extended. After the filaments and voids were formed, the primary giant filaments behaved in a manner similar to those seen in laboratory experiments and simulations. Experiments in the laboratory and measurements of galaxy and cosmological phenomena reveal that plasma behaves in a consistent manner regardless of size, from the scale of laboratory experiments up to the scale of galaxies and galaxy clusters. This means that we can up-scale the results we obtain in the laboratory to accord with what is seen in the universe. It is at this point that the experiments and simulations of Dr. Anthony Peratt of the Los Alamos National Laboratory come into focus. When plasma filaments have parallel electric currents running in the same direction, experiments show that the interaction between these filaments form an entire sequence of familiar astronomical objects. The final formation depends on (1) where the interaction ceases; (2) at what stage we are viewing the interaction out in space; (3) the strengths of the electric currents flowing in them; and (4) the number of interacting filaments. Interactions of up to 12 filaments have been studied, but most observed objects form with just two or three filaments. As two filaments approach under the influence of their magnetic attraction, the plasma between them becomes concentrated and the first result is a double radio galaxy, with the two current filaments producing the radio lobes. Typical examples in space are Cygnus A or Centaurus A which is shown in Figure 9 below.
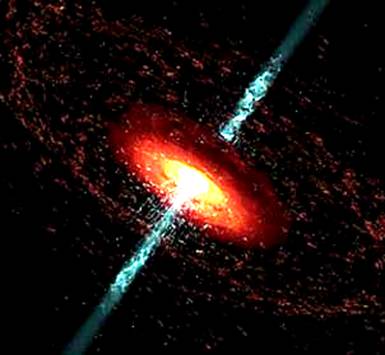
Figure 9: Double Radio-galaxy Centaurus A showing the two radio lobes that mark the interacting filaments. As the filaments continue to approach each other, quasars and active galactic nuclei will form, accompanied by polar jets. We see these as quasars, and these are observed in most distant galaxies. Quasars are the ultra-brilliant cores of galaxies in the early universe. Their light can be over 1000 times brighter than whole galaxies and can be seen everywhere across the frontiers of the universe. Nearly every galaxy in the universe had a quasar at its core initially.
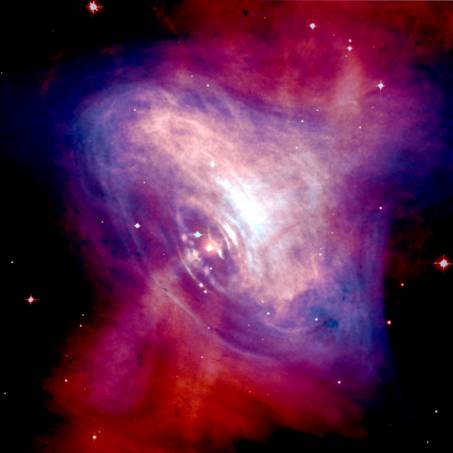
Figure 10: An artist's drawing of a quasar with its surrounding galaxy, which is dim by comparison. But, as time went on, the brilliant activity tapered off and the jets faded. All that is left of the quasar at the center of our galaxy is a spinning disk of material that occasionally emits X-rays. The rapidly spinning disk with polar jets is a characteristic of plasma phenomena. The same structure on a smaller scale can be seen around certain types of stars, such as the example in Figure 11 below which forms part of the remnant of an exploded star in the Crab nebula in Taurus.
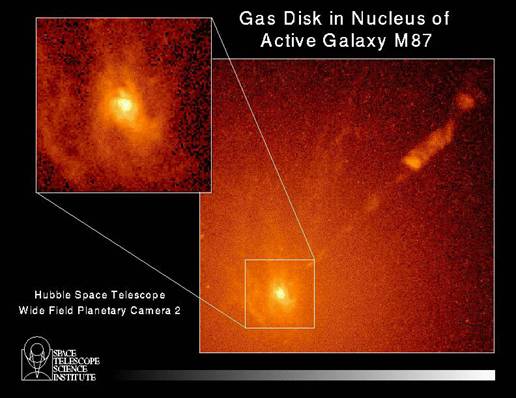
Figure 11: Spinning disk and polar jets in the Crab Nebula explosion remnant. The sequence of filament interactions then progresses to various types of elliptical galaxies, some of which retain their polar jets as in the case of the giant elliptical galaxy M87 (Figure 12).
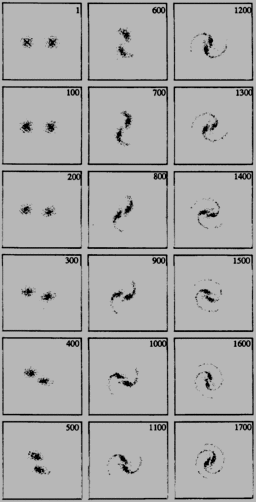
Figure 12: Spinning disk and polar jet at the center of giant elliptical galaxy M87. Finally, at the end of the sequence, spiral arms develop and lengthen, and then thin out as they wind around the elliptical core, forming a variety of spiral galaxy types. This process can be timed in the laboratory and up-scaled to the observed galactic dimensions. The photographs of what was seen in the laboratory can be seen in Figure 13, below. There is one additional factor that needs to be considered: the lower strength of the ZPE in the early universe. The strength of the ZPE affects the electric and magnetic properties of the vacuum. It is the electric and magnetic properties of the vacuum which determine the rate of plasma interactions. This is discussed in “Reviewing a Plasma Universe with Zero Point Energy.” This paper shows that the velocities of approach of plasma filaments, the formation of astronomical objects by plasma interaction, and the sorting of ions in plasma are all inversely proportional to the strength of the ZPE. This means that these processes are directly proportional to the speed of light. Thus, when the speed of light is 10 times its present value, plasma interactions must occur 10 times more quickly. We have shown we can calculate the speed of light at any given instant throughout Creation Week (equations 11-13, above). Therefore, using the speed at which we see filaments reacting in the laboratory, we can mathematically calculate how fast plasma interactions were occurring in the early universe. If the reaction times are simply upscaled, then the speed at which the early filaments in space would interact under today’s conditions does appear to be billions of years. But when the strength of the Zero Point Energy is taken into account as it existed at that time, the speed of filament interactions is shown to be enormously faster than what we see now. In his papers “Evolution of the Plasma Universe: I and II”, A L Perratt supplies the following details of his experiments [IEEE Transactions on Plasma Science, vol. PS-14, No. 6, December 1986, pp. 639-660 and 763-778]. Further information on plasma physics is available from the Los Alamos Laboratories website. On page 646 of his IEEE paper, Peratt states that the time steps (the increments of time used to determine the speed of plasma interactions) in the laboratory examples were in terms of 1.04 x 10⁻⁴ seconds. For conversion to galactic examples a scaling factor of 5.6 x 10¹⁵ is needed. He then states that this gives time steps for actual galaxy examples of 5.87 x 10¹¹ seconds. The simulation runs that he made for Part I of his article were usually completed after 300 time steps. At the close of these 300 time steps, the core of a galaxy had formed along with its associated quasar and jets, and remnant radio-lobes. This means the experiments indicated that, when up-scaled to the size of objects in the universe, actual galaxy cores and their features had formed in 300 steps of 5.87 x 10¹¹ seconds. That is to say it formed by plasma physics in an actual time of 1.761 x 10¹⁴ seconds, or over 5.5 million years for the first galaxy cores to form. The results, however, are a little different when the strength of the Zero Point Energy at that time is considered. During most of Creation Week, equation (13) shows that the speed of light, and therefore plasma interactions, were at least 109 times faster than now. In the early part of Creation Week these were about 3.526 x 10⁹ faster. We therefore divide [1.761 x 1014 by 3.526 x 109] to obtain the actual formation time of galaxy cores and their associated features. The result is that they were formed in 49,943 seconds, or about 13.87 hours. The light from the emerging quasars at the centers of most galaxies was therefore shining through the darkness just over half a day after the Creation event. This means light from the quasar which existed at the center of our own galaxy, at 30,000 light years' distance, would have reached the earth in about 268.5 seconds, or about 4.5 minutes. In Part II of Peratt’s paper, he continues the description of his experiments and simulations. On page 768, Peratt describes what happened when the number of time steps increased beyond 300. What he saw in the lab corresponds to the changes which then occur in the elliptical cores of galaxies. By a time-step of about 600, coalescence of the outer plasma components on the excited inner core has begun. The series of photographs of what happened in Peratt’s laboratory is shown here in figure 13, where the photographs are taken looking down at the two filaments as they began interacting.
Figure 13: Image sequence from one of Peratt’s laboratory experiments The time sequence numbers can be seen in the upper right hand corner of each photograph. Note that the spiral galaxy form is well developed by time step 1700 in the last frame. What is not seen in these photographs is the fact that there is a core of plasma trapped between the two filaments which is getting progressively more compressed. For this reason the development of the double radio galaxy, quasar and elliptical nucleus in the center between the two filaments does not appear in frames 1 to 600. Astronomically, however, this is effect is very clear in Centaurus A, figure 9 above, as well as this photograph
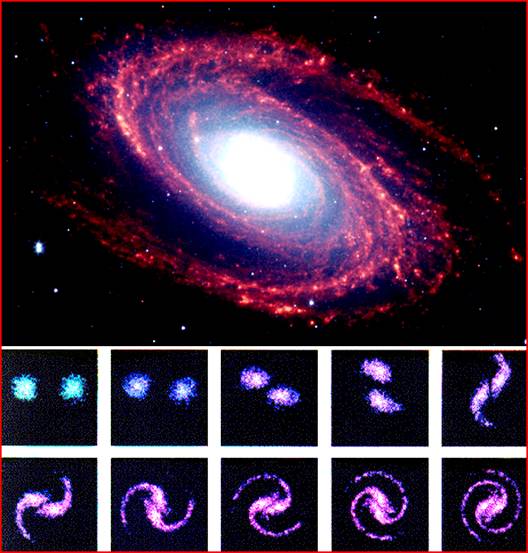
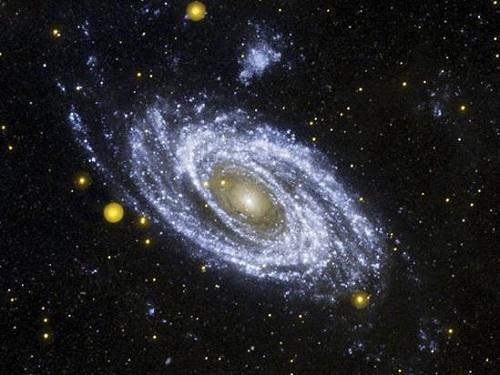
In the above photograph, we are looking down at the two filaments, which are blue and green in this picture. As they approach each other, the plasma between them is getting compressed. The dark area is a band of dusty plasma. This compression results in a very tight nucleus. The compression also results in initial star formation in the newly-formed core of the galaxy. These would later become known as Population II stars. When Peratt upscaled the reactions he saw in the lab to what happens in actual galaxies, he used a conversion time of 5.87 x 10¹¹ seconds, based on actual examples of what we are seeing happen today. The development of spiral arms in the laboratory plasma galaxies is completed somewhere between time steps 900 to 1750, depending on the parameters of the interaction. The same holds for actual galaxy formation. Thus, by time-step 1500, we are getting the picture of what is happening in galaxy formation. The photograph of Galaxy M81, below, shows quite clearly that what Peratt saw in the lab exactly corresponds to what we see through our telescopes.
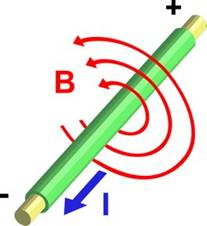
Figure 14: Image of plasma filaments making up the arms of spiral galaxy M81 with Peratt’s experimental galaxy formation sequence from plasma beneath for comparison. Now a time-step of 1500 multiplied by 5.87 x 10¹¹ gives us a formation time of 8.8050 x 10¹⁴ seconds (27.9 million years) with the ZPE at its current strength. However, the ZPE strength was significantly lower in the early universe. A good average value for the speed of light during the middle segment of Creation Week is 2.386 x 10⁹ times its current speed. This means that, to find the actual time it takes for the formation of galaxy spiral arms during Creation Week, we must divide 8.8050 x 1014 by 2.386 x 109 which gives us a formation time of 368,950 seconds or 4.27 days. The stars in the spiral arms would be shining shortly after. Interestingly, our own Sun is one of the stars in a spiral arm of our Galaxy. Most other stars in our night sky are also spiral arm stars; stars that “give light upon the earth.” Genesis 1:14-19 indicates that these spiral arm stars, including our Sun, would begin to light up during the second half of Day 4. This is in strict accord with the ZPE-Plasma Model and the plasma experiments. The plasma experimental data also agree with a basic astronomical observation. There are two main groups or Populations of stars. The old stars are the Population II stars which are found in the cores and halos of galaxies. The plasma experimental data, coupled with the ZPE factor change, indicates that these old Population II stars were shining on the second half of Day One, which would be the first morning since the Bible defines each day as starting with the evening preceding it. The young stars are called Population I and are found in the spiral arms of galaxies. Again, this is in full accord with the plasma data as well as the Bible. When coupled with the ZPE change, the evidence indicates they, including our sun, started shining during the second half of Day Four. This is exactly what Scripture tells us regarding both the order and timing. But the old or Population II stars from Day One are also mentioned in Job 38:7. There they are called “the stars of the morning” since they illuminated on the first morning of Creation Week. Star formation has been mentioned in passing, but how, actually do stars form? The standard Big Bang model claims gravity is responsible. The standard creation models don't try to deal with it. However, without going into details, the problems presented by the Big Bang model have required the theorists to postulate all sorts of things they have never seen, such as dark matter, dark forces, etc. If we follow the effects of plasma interactions, however, it becomes clear that star formation is an inevitable result. Nothing ‘dark’ needs to be postulated at all. Every electric current is associated with a surrounding magnetic field.
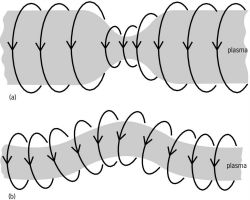
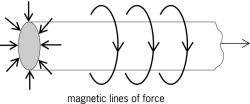
Plasma filaments are no exception. In fact, it is the magnetic field which keeps them filamentary instead of evenly dispersed throughout space. This magnetic field, like all magnetic fields, is quite susceptible to instabilities. When this happens, there is a pinching effect on the plasma filament, as shown below:
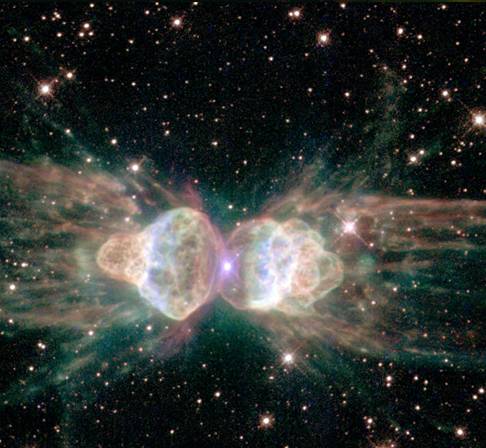
There are several types of pinches, two of which are shown here. Look at the top one. Where this pinch happens, the material in the pinch is compressed into a ball, and stars form. It’s as simple as that. A beautiful example of this pinch can be seen in the Ant Nebula: The star at the center of the pinch can be clearly seen in this photograph. In discussing star formation, Peratt comments [op. cit. p.772 & 775] that “Stars form first in the densely compressed elliptical core (Population II stars) and then in the pinched plasma that make up the spiral arms (Population I stars).”… “Star formation in the elliptical [nucleus] is expected to start earlier [than otherwise expected] because of the compressive forces on the dense plasma contained there.”. Furthermore, although the forces causing the compression and collapse in very dense cores are unchanged, the velocity of that compression and collapse is again proportional to c or 1/U (U is the strength of the Zero Point Energy). Star formation will thus be even more rapid than expected by plasma physicists. Similarly, in the spiral arms of galaxies, the plasma pinches rapidly form stars like strings of beads along the many lesser filaments there in the areas that are pinched. The rapid collapse of the plasma spheres formed by the pinch would then ensure that these Population I stars lit up very quickly. The evidence for these stars forming like beads on a string is very clearly observed in galaxies such as M81 in the following photograph:
Genesis 1 indicates something else which seems to go against what modern astronomy presents. Genesis 1 says the earth was formed before the sun lit. This, however, is exactly what would happen if the plasma model is correct. Some plasma filaments fragment within themselves, becoming something like a cable with a series of wires running through it, the wires being daughter filaments.
They are, however, bound together by the containing magnetic field. As with all plasma filaments, the magnetic field around it is quite reactive to any changes around it, and may respond to changes by pinching in on the plasma filament.
When this happens, the outer daughter filaments will ‘feel’ the pinch first and react. When they pinch, they form balls. At first they are simply balls, but as the reaction progresses, there is a point at which the forces of gravity start to exert themselves within this electromagnetic field. These ‘balls,’ or planets, begin orbiting the central core in the direction of the magnetic lines of force. As the pinch progresses inwards, more concentric ‘balls’ are formed until the pinch at last hits the central, largest filament. This reacts to the pinch by not only becoming a ball, but under the force of the pressure, lighting up. In other words, the Bible is exactly correct to refer to the earth, and even the land rising out of the primeval seas, as being in existence before the sun itself lit up. Plasma interactions do one more very interesting and very important thing: they layer the elements involved. This layering is the result of the ease of ionization of the elements. The heavier elements, including the radioactive elements, are very easily ionized and thus at the center of the planets. In fact, the order of planets out from the sun shows the same ordering, with little Mercury having the largest heavy core relative to its size. It is for this reason that the earth itself had water on its early surface as well as under it.
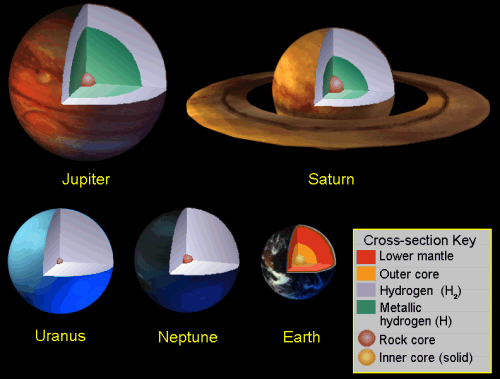
compare it with some of the other planets:
Star and planet formation, and the layering effect, are discussed in more detail in the September 2008 paper “Reviewing a Plasma Universe with Zero Point Energy”
IV. DATING THE GEOLOGICAL COLUMN From equation (14), the approximate dates on the orbital clock of important geological events can now be determined. Let us take the three catastrophes which closed the main geological eras.
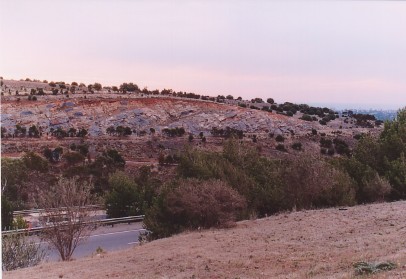
The most ancient strata are collectively called the Archaeozoic Era. This was effectively closed by the catastrophic geological event commonly called “Snowball Earth.” The time when this occurred is now called the Cryogenian Period, which started about 840 million atomic years ago. Snowball earth strata begin with a diamictite which is a conglomeration of pebbles, cobbles and boulders in a cement-like matrix. In many areas this strata is over 300 meters thick. This diamictite is often referred to as tillite for reasons explained below. An excellent example is on the web here. These pebbles, cobbles and boulders comprise both local rock types as well as rock-types that have been transported over 500 kilometers. Most geologists consider the prime method of transportation for rocks over that distance to be ice. As a result, they have called the diamictite a “tillite,” which has distinctly glacial implications. Indeed, because the diamictite has been found in locations that, at the time, were at sea level on the equator, the assumption is that the whole earth must have been frozen solid and covered with a great depth of ice during that period. However, there are several problems with that scenario, as can be seen in this strata in South Australia. There, a stratum of windblown sand, the Whyalla sandstone, is of the same age as the diamictite. It shows that not only was the whole world not covered by ice, it was not even covered locally in South Australia. Furthermore, rhythmites showing the effects of diurnal Lunar tides are found in associated strata. Rhythmites are layerings which are caused by tidal action. They can occasionally look similar to something called 'varves,' which are annual, but they are not the same thing. A good example of rhythmites can be seen in the boulder below:
While a good example of varves can be seen in the following photograph:
If tides are occurring, there is open water. Therefore the whole earth could not have been frozen over. There are a number of other evidences which show that the whole earth could not have been covered in ice. However, one key piece of evidence is the cement-like matrix in the South Australian diamictite. It is a type of dolomite (a form of limestone) that can only be formed in warm to hot water. This introduces the possibility of an entirely different scenario. We have clear evidence on Mars of catastrophic flooding. Evidence of the eruption of water from its interior takes a variety of forms. For example, the largest outflow channel system on Mars is found on the north-west slopes of the Tharsis region. Dr James M. Dohm of the University of Arizona stated:
In the news release from the University of Arizona for 3rd August 2001 Dohm elaborated further:
Why would water burst out from Mars' interior? Whether one is dealing with plasma or gravitational models of planet formation, one major point of agreement is that there were no radioactive materials on the surfaces of the rocky planets initially. That means the radioactive materials were decaying under the surface. This produced immense amounts of heat, and this heat would drive water out of the rocks, minerals, and crystal lattices. This water would then be pooling under the crust while pressure from the heating continued to build. At some point in time a critical point would be reached and those waters would have to outpour onto the surface of the planet.
The above is in false color. The blue is the lowest area and the red is the highest. The picture below shows in blue where all the water was after the flooding.
If this has happened on Mars (and there is also evidence the same thing happened on Venus), similar events may also have happened on earth. In each case, radioactive heating would have driven the water out of hydrated minerals in the mantle of the planet. After reaching a critical point at which the crust could no longer resist the building pressure, water would have burst forth from the interior of the planet. To obtain some idea of the quantity involved for the Earth, we note that the approximate diameter of Mars is 4,200 miles compared with Earth’s 8,000. This means that the volume of Earth is 6.9 times that of Mars. Therefore there could have been approximately 6.9 times the volume of hydrated minerals under the earth's crust. That would mean approximately 6.9 times the volume of water outpoured on Earth compared with Mars. The total water volume erupted on Mars was calculated above by Dohm as 110 million cubic kilometers (96 + 14). This means that the approximate amount outpoured in the case of Earth could easily have been 759 million cubic kilometers (110 x 6.9). In the case of the Earth, the outgassed volume of 759 million cubic kilometers is 2.6 times the volume of the Indian Ocean or 2.1 times the volume of the Atlantic with all its adjacent seas. It is approximately equal to the volume of the Pacific if its smaller adjacent seas are ignored. In other terms, since the total volume of the Earth’s oceans is currently 1.3 billion cubic kilometers, this means that just over half the volume of our present oceans could have been outpoured in this event. The distinguishing characteristic which marks the beginning of the "snowball earth" sequence is a change in carbon isotope ratios in the rocks. Studies have shown that these ratios linked with the "snowball earth" phenomena started changing about 830 million atomic years ago. If we now substitute that atomic date for te in equation (14), we discover that the terms containing the orbital time ratio T inside the square brackets become te = 4.7846 x 10⁹ [(arcsin T) - √ (1 – T2) + 1] (14) we get [(arcsin T) - √ (1 – T2) + 1] = 0.1735 (15) Calculation then reveals that T = 0.16000 = y / 2688 so that y = 430 orbital years (16) In other words, when we plug in the atomic value for the onset of the "snowball earth" scenario, we get a match with 430 orbital years. Where is this 430 years to be put in an orbital calendar? When atomic ages are considered, the increase in the Zero Point Energy, and thus the continuing red shift function lasted from the beginning, estimated as 12.3 billion atomic years ago in this paper, to about 10 million atomic years ago. The change in the carbon ratios in the rocks is considered to be diagnostic of the 'snowball earth strata.' This change started around 830 million atomic years ago. The actual Cryogenian Period, which is how this time is labeled, is considered to have started about 840 million atomic years ago (for purposes of calculation the 830 figure is being used because that is the date for the change in the carbon isotopes in rocks). However, when the calculations are done to find where the atomic ages fit with orbital time, as described above in The origin of the cosmic microwave background (equation 8), the length of time it took the Zero Point Energy to reach a maximum was 2688 years. As with atomic time, this date starts with the origin of the cosmos. The time given for the onset of the "snowball earth" strata formation was within the red shift curve time. That means that these strata were laid down before the red shift function ended. The figure of 430 orbital years, above, gives us the orbital time BEFORE the red shift function ended as the time when the strata under discussion were laid down. When we subtract that 430 years from the 2688 years, we find that this event occured 2258 years after the origin of the cosmos. It is interesting that 2258 years after Creation is very close to the 2256 years after Creation that marked the onset of Noah’s Flood according to the Alexandrian Septuagint text. This LXX text was translated from paleo-Hebrew into classical Greek about 280 BC by Jewish scholars and reflects the earliest textual data we have. It is backed up by those Dead Sea Scrolls which were written prior to 70 AD, and the subsequent writings of the Church Fathers, as well-researched by Bradshaw in Creationism and the Early Church. Under these circumstances, the catastrophic outgassing of water from the earth’s interior would certainly account for the features of the snowball earth strata. The Bible gives us some interesting clues here. In Genesis 2:5-6, mention is made of the entire land being watered by waters coming up from the ground -- even before plants started growing. This means water under the surface was already under pressure, and that means that radio decay was progressing extraordinarily rapidly at that time. This fits exactly with the steep initial drop of the red shift curve, which indicates a very high initial value. That means atomic rates, including decay rates, were extremely high at the beginning. By the time the Garden of Eden is mentioned, just a few orbital days later, there is already enough water coming up there to become the headwaters of four major rivers. Then, in Genesis 7:11, we read, "...on that day all the springs of the great deep burst forth..." In one day. All the springs. Possibly triggered by a series of asteroid hits, this enormous bursting forth would have carried up with it millions of tons of hot mud and pulverized debris and it is this which the Bible says continued to rain down for forty days and forty nights. This massive outpouring of water first caused the diamictites, or 'tillites' pictured above, as they were slammed into various areas by the force of the moving waters and laid down. Immediately above the diamictite in South Australia are a series of deepwater slates, shale and siltstone, which are finely laminated and called the Tapley Hill sequence. This sequence is 2.5 kilometers thick and has a high carbon content. It also includes kerogen, which normally forms as the breakdown product from muscular tissue. If the Flood of Noah's time was as fierce as the data indicates, then there is not a chance that anything was fossilized. Instead we would see exactly what we do see in this finely layered strata -- layers of black on black, containing a high content of material normally associated with life forms.
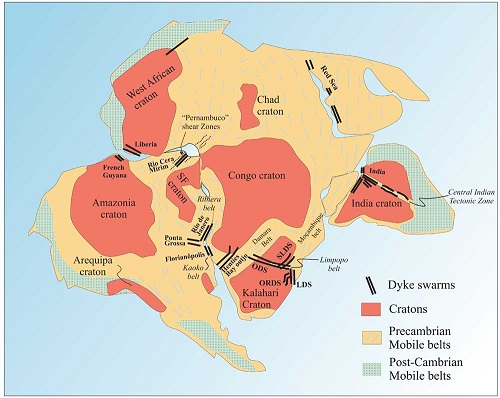
laminations in the Tapley Hill sequence part of the Tapley Hill sequence A more complete discussion can be found on “A Brief Earth History” with more specific discussion about the "snowball earth" sequence at "A Snowball Earth or....?" During this geological period, the Cryogenian, the atomic clock was ticking off about 2.1 million years in every orbital year. This massive outpouring of water, and accompanying rains, covered the earth the same way Mars' waters covered it. In the case of the earth, major sections of the land downwarped not only due to the aquifers under the crust becoming partly emptied and the land sinking down in those places, but also because of crustal shifting as the earth adjusted. That there was one major continent to begin with, both the Bible and geology agree. These downwarped areas occurred primarily where the great outbursts of water had occurred. This was not everywhere. There were a number of areas where large cratons had been formed. Cratons are stable areas which were formed deep in the earth's crust before the waters were outpoured. They are the cores around which today's continents exist.
The map above shows the southern part of the supercontinent immediately after the water outpouring, referred to biblically as Noah's Flood. What are labeled 'dyke swarms' are weak areas of the crust where magma was leaking up afterwards. These may well have also been primary areas where the 'fountains' exploded. The tan mobile belts are areas around the cratons which were settling and moving. They included many downwarped areas. It is here sedimentation was occuring, in large part from material washed from the cratons. The geological settling did not suddenly end after the waters had drained off the land. The areas which had sunk, including those underwater, were still settling into place, with resulting massive earthquakes, and thus massive mudslides would have been frequent. This, then, is where we find our first layers of fossils. The lowest would be underwater and are called the Cambrian strata. These are the mud-dwellers, shallow water organisms and some deeper water organisms who had wandered into the wrong place at the wrong time. This massive amount of fossils is referred to as the Cambrian Explosion. In standard paleontology this strata is said to the showing the first large life forms on earth, but the evidence disputes that, as many of these forms are quite complex. The standard creation models simply state that these organisms were buried first during Noah's Flood. However the geological evidence indicates these organisms were fossilized after the flood. The next strata going up in the geological column are from those downwarped, marshy areas on land where ferns, mosses, algae, insects, spiders, some amphibians, and the like would be abundant. These were the areas where the earth was still shifting and mobile. Large animals and people would be up higher on dry land, not living in these marshes. So, in these strata, we would not expect to find any fossils or remains of animals or plants which were not comfortable living in marshes.
It is important to note at this point that simply burying something does not result in its fossilization. Most buried things rot in time. Fossilization requires highly mineralized waters, sudden burial by muds permeated with these waters, and then draining to allow the material to dry and the minerals to be exchanged for the carbon content. Both here in the marsh areas and later in the geologically active areas where other fossils were formed, these waters, extruding from under the crust, would allow fossilization, whereas most of our waters today will not. The reference here is to replacement fossilization, not imprint fossilization. Imprints can result from any two different, wet layers sandwiching something and draining quickly so that between the layers as they dry is the imprint of what was once there. The Paleozoic era was brought to a close by the Permian extinction. The geologic record shows an abrupt change in both rock type and fossill type at the close of this process. During that time major coal seams were laid down and rampant volcanism outpoured the Siberian Traps with over a million cubic miles of basaltic magma. An asteroid impact or series of impacts. may well have been involved. However there may also have been another cause, which will be discussed a bit later. The Permian period dates geologically from about 300 million atomic years ago (dating from when the first coal seams of this time were laid down) to about 251 million atomic years ago. Here is the first interesting thing to think about. If atomic dates are the same as orbital dates, that means some kind of catastrophic period lasted about 49 million years. Standard geology says these catastrophic events lasted that long but the end date is used because of the geologic strata change. Let's take a date in the middle of that atomic time span and find out where we can put this time in orbital years. If we take a middle date of about 289 million atomic years ago and insert it in equation (14) above we find that [(arcsin T) - √ (1 – T2) + 1] = 0.060402 (17) Calculation then shows that T = 0.058779 = y / 2688 so that y = 158 orbital years (18) This does not mean this period lasted 158 years. This shows that the Permian period and its extinction occurred about 158 orbital years before the end of the redshift function when T = 0. We can then calculate the time that this event occurred after the origin of the cosmos by subtracting 158 years from the total 2688 years that the redshift function was operating. When we do this, we find that the Permian was in full swing about 2530 orbital years after Creation or about 270 years after the snowball earth Flood strata formed. Biblically, this was very close to the time of the Babel catastrophe according to the Alexandrian LXX genealogies, but omitting the second Cainan, (who was also omitted by Josephus). The comment in Genesis 10:2-8 implies that the Babel catastrophe occurred in the second generation after the Flood, or perhaps early in the third generation. In this context, the Alexandrian LXX account in Genesis 11 gives generation times as being about 100 to130 years, so that 270 years after the Flood is certainly in the right time period for the Babel event. Therefore the Permian extinction is closely linked with the Babel catastrophe according to the data we have here. During this period, the atomic clock was ticking off about 1.9 million years every orbital year. So while atomic dating says this period lasted 49 million years, the orbital time involving this series of catastrophes was 25.7 years. What sparked this series of catastrophes? We know volcanic events were involved. We know there is a huge section of the earth's crust which was block faulted down. At the time the earth was still essentially one continent and this massive downwarped trough extended across what is now Europe and through Spain into North America. Whatever happened during these years was violent enough to wash tons of plant material into this trough, so that this is now a giant coal seam, starting in Europe and ending with the Appalachian coal seams. We know there is a change in rock type and fossil type at the end of the Permian time. We know the Siberian basalt traps were outpoured at this time. There is also evidence from ice-probing airborne radar of what appears to be a giant meteor crater 300 miles in diameter under the Antarctic ice (Wilkes Land, East Antarctica) which dates from this time. We know from this data and more that what happened during that 25 years involved a series of worldwide catastrophes. If this event and the Babel catastrophe in the Bible are the same, which the timing suggests, then the Bible may give us a couple of more clues. The first one is found in Genesis 11:5, where we read, "But the Lord came down..." This phrasing is used only one other time in the Bible, in Psalm 18. That section of the Psalm refers to giant earthquakes, the foundations of the mountains shaking, smoke and fire from the sky, dark clouds, winds, hailstones and great bolts of lightning, resounding 'shouts' from the heavens, the sea floors being exposed and the 'foundations of the earth' being exposed. Biblically, then, whatever is associated with the Lord coming down is not the same thing as the conversations the ancients may have had with angels or God. It was something catastrophic and intensely frightening. The second clue is also in Genesis 11, in verse 9: "That is why it was called Babel -- because there the Lord confused the language of the whole world. From there the Lord scattered them over the face of the earth." Many consider this confusion of languages to be miraculous or false -- or perhaps simply the natural changes that go on in any living language. But if we look at the first clue, there may be a connection. Medical research has shown that electric shocks to the brain can confuse the language center. We have seen strokes do this. Electric shocks do the same thing. So what happened? If we go back to our study of plasma before, we can add to the information now. Every planet in our solar system has a plasma sphere around it. The lower part of the earth's plasma sphere is called the ionosphere. The earth is quite small compared to its entire sphere. Every planet is the same, with the solar wind causing the plasma sphere to trail out behind it like a giant wind sock. The plasma sphere of Venus, for example, extends past the earth's orbit. In the early days of our universe the plasmas were all much more highly charged. Thus, when one planet passed through the tail of another planet, a giant electric discharge could occur. The ancient people saw these discharges between other planets in the sky and this may be one of the cores forming stories about the wars among the gods. At the time of Babel it is very possible that the earth itself received such a discharge either from us passing through Venus' tail or Mars passing through ours.
If this kind of an electric discharge was what happened, then we have not only the explanation for the confusion of the languages, but for many of the other data associated with the Permian as well. Where did this discharge hit? Possibly it is what is responsible for the 'crater' in Antarctica. Or, perhaps that is a meteor crater. What is interesting is that it was on exactly the other side of the earth at that time that the Siberian traps were poured out. Something triggered that outpouring. Whether, then, we are dealing with a single electric discharge event or a combination of this and a giant meteorite hit, we can account for all the data. It is interesting that there exists today in astrology the memory of danger being associated with the lining up of the planets. They have no idea why, but if we consider the electric discharges our early ancestors saw happening, we can understand. This event or combination of events would have most certainly caused a massive extinction event, and that is what we see in the geologic record. It most certainly did not take 49 million years. Would it have taken 25 years? There are two possibilities here: either we are dealing with two events, rather closely spaced, or we are dealing with 25 years of continuing destruction after the initial event. Either way, the earth was quite different afterwards. This new time is called the Mesozoic Era. The Mesozoic Era and the K/T extinction The volcanic outpouring of the basalts in the Siberian traps during the Permian years would have, in conjunction with the multiple other eruptions going on around the world, vastly increased the carbon dioxide content of the atmosphere. This was the beginning of the Mesozoic, or Middle Life, Era. The world had become hotter and dryer and windier. Few marshes were left, but there remained giant, luxuriant river valleys. It was here where there was not only ongoing geological settling, but also one of the few places where the giant animals such as the dinosaurs could continue living. The most active geological areas were around the edges of the supercontinent. These active zones were broad in some cases and in China reached far inland along the river valleys. And this is where we find those fossils today; fossils of large land and river dwelling animals, birds, some small mammals and the lizards. The palms and pines were abundant in these areas as well. Many higher areas had become windy, sand-blown deserts and those deposits can be found in these strata. There are some fossils in these deposits. How did that happen? Remember the land was mobile at the time, not only shifting from side to side, but up and down as the earth settled from the latest series of catastrophes. It was not so much the sea level that rose and fell, then, as the land itself which rose and fell in sections, thus inundating some sandy areas with water which would then drain, allowing this fossilization to take place. These fossils in the wind-blown sand deposits are all in the mobile belts around the edges of the ancient supercontinent. In the Mesozoic Era, which followed the Permian extinction, the earth's interior continued to heat up from radioactive decay processes. Again these processes were still much faster due to the lower strength of the ZPE. It would not finish building for some time yet. Indeed, the ZPE was still building to its maximum right up until the time the redshift function terminated at T = 0, or 2688 orbital years after creation. At this point we are still at about 2550 or a little more after creation. As the radio decay heating continued, the earth’s interior eventually became substantially molten. W. J. Moore in Physical Chemistry, 3rd edition, p.415 (Longmans, New York, 1961), points out that when rock becomes molten, its volume increases by at least 10% since inter-molecular spacing increases from 3% to 5%. As a result, tremendous pressure was again being applied to the crust of the earth from its interior. There is geological evidence of a series of asteroid strikes marking the end of the Mesozoic Era, whose remnants can be seen stretching from just north of present-day Mongolia, across the Ukraine and Algeria and down into the Yucatan, where the major Chicxulub crater is still a much-studied structure. These asteroid hits were evidently the trigger which caused the mid-Atlantic rift to start unzipping.
While the initial ‘unzipping’ was swift, the separations of the continents probably continued for about two hundred years. This was the result of the enormous internal pressure caused by the increase in volume when radio decay heat melted the rocks. This process involved the splitting of the super-continent of Pangea and the formation of the Atlantic ocean. A 10% increase in the volume of melted rocks translates into an 18% increase in circumference. At the equator, the Atlantic Ocean is about 18% of the Earth's circumference. The new ocean floor was formed with the excess magma from the earth’s interior. Here is a good diagram of the process.
Core samples 40 and 42 from the Scripps Deep Sea Drilling Platform show that the first strata on the Atlantic ocean floor off Africa is the same strata that are associated with the wipe-out of the dinosaurs. This event is called the Cretaceous/Tertiary extinction, or K/T extinction. A similar event has happened to Venus. However, in that case, the planet’s crust had many pre-existing cracks and fissures which allowed the excess magma to well up from the interior and completely re-surface the planet. This process buried all existing features, leaving Venus with a comparatively young surface. Only features which formed after this re-surfacing event have been preserved for us. In the case of the earth, the internal pressure and the mobility of the mantle has allowed the tectonic plates to move and new ocean floors to form instead of a resurfacing event. The atomic date for this catastrophic event is 65.5 million years. Up until now, we have been figuring events from the inception of the universe, or the beginning of Creation. We are now, however, approaching the end of the red shift curve, which was completed when the Zero Point Energy finished building to its maximum. However, at the end of the build-up of the Zero Point Energy, atomic processes were still much faster than now. The reason for this has to do with the oscillation which followed. The initial expansion of the universe was completed within a few orbital days, although that translates into atomic time as billions of years. The universe then began gently oscillating. This oscillation, however, was not noticeable until the Zero Point Energy had finished building to its maximum -- after all the Plank Particle Pairs had recombined. At that particular point, the universe happened to be in a slight contraction phase. This meant the energy density in the ZPE was increased somewhat due to the contraction, slowing atomic processes even more. However they were not as slow as today -- that was still to come. The main point which is necessary here is that there is an atomic ten million year 'gap' between right now, today, and when the red shift curve ceased operation. This amount of time is the result of the effect of the oscillation on atomic processes. It will be important to understand this in the equations which follow. Going back to the separation of the continents, the Bible gives us information regarding this in Genesis 10:25. There we are told that the earth (the super-continent) was divided in the days of Peleg. The word Peleg itself comes from a root which means to “split in two with a channel of water coming between”. This is a good description of what actually happened to the super-continent. In addition the word used for “earth” is eretz which was used to describe the original super-continental land mass in Genesis 1:10 and always refers to solid matter, such as a land mass. According to the Alexandrian LXX chronology, but omitting the second Cainan, Peleg was born 2657 orbital years after Creation, or some 400 years after the Flood, or about 130 years after the Babel catastrophe. This date is 31 years from the end of the redshift curve. As a consequence, the atomic date for Peleg on the redshift curve is going to be important. The atomic date for the beginning of Peleg’s continental division is given by the following calculation. Since Peleg is 31 years from the time T = 0, then we have T = 31/2688 = 0.011532 (19) Substitution for T in (14) then gives us te = 55.5 million atomic years (20) This is precisely 10 million atomic years short of what is actually recorded by atomic clocks. As explained above, the evidence shows that from the end of the red shift function to the present time ten million atomic years have elapsed. This is explained further later on. As a consequence, the extra 10 million years also has to be added to the atomic dates derived from the redshift function as we go back to the origin of the cosmos. Therefore, the atomic date for the onset of the Cryogenian Period becomes 840 million years ago instead of 830 as indicated above. The beginning of the Permian becomes 299 million atomic years, and the K/T extinction began 65.5 million atomic years ago. These atomic dates are all in accord with the known data. It should also be noted that the atomic clock was ticking off about 1.8 million years in one orbital year during the days of Peleg, which corresponds to the K/T extinction period. As a consequence, it has often been wondered why many dinosaurs took several million atomic years to die out after this catastrophe. In actual fact it was only a few orbital years, but this puzzle for geologists has led some to believe that the extinction event was not sudden enough to be caused by an asteroid impact. As a result, some have searched for other mechanisms. This search is unnecessary when the data are examined. The fossils which date from the recent, or Cenozoic Era (after the K/T extinction event) are of mammals, deciduous trees, and a world we recognize as being like our own. Why were the mammals, which had previously mostly escaped the catastrophic burials which were resulting in fossilization no longer escaping? Here, the Bible gives us a clue. First of all, in the Table of Nations, Genesis 10, we find the name of Peleg. His brother, Joktan, had thirteen sons, the youngest of whom was named Jobab. There is some very strong evidence that this was the same person who is referred to as Job in the book of that name. If we look at the book of Job and look for natural events which happened during his time, we see some startling indications that the world he knew was in violent upheaval.
This last quote is interesting. If the continents were indeed dividing catastrophically during this time, the tsunami action would have been incredibly fierce. Men would keep a watch over the sea. This is because the beginning of tsunami activity is a pulling back of the waters far out into the ocean (for a large tsunami) before the giant waves hit. Large ocean animals would be stranded when the sea pulled back, thus a watch over the large animals, such as the whales. Two much larger animals which are associated with water are also mentioned in Job: the behemoth and the leviathan. The behemoth obviously lived in the lush river valleys, while they remained. This catastrophic event was also connected with a further axis tilt which sparked the ice age, which is also mentioned in Job. The more severe seasonal extremes meant that the animals best able to survive, in any of the world’s areas, would be those who were warm-blooded, and so they are the ones we see primarily in the Cenozoic strata. Could one flood produce most the geologic column? The major creation organizations today promote the idea that Noah's flood produced the vast majority of the geologic column as well as the fossils in it. Others say the geological column does not really exist at all. But if we follow the data, we not only have a geologic column divided into four major, world-wide eras, but examination of these layers denies the fact that one flood could have laid them all down. There is something which occurs across Europe with a similar situation in China. In Europe you have a major coal seam extending through Spain and across into America, from before the division of the continents. On top of that, in a number of places, there is a large, in situ, sponge reef. Sponge reefs take time to build. On top of that, again in several places, are layers of dinosaur nests, which appear to be annual. This is not possible if the Flood, in one year, deposited all these layers.
In the middle of the above map the black dots are the coal deposits. Note the series in the middle stretching across Laurasia (an alternate spelling is on the map). These were laid down before the continents were separated, as the one major deposit extends in a line as described above.
Iberia is Spain. These sponge reefs, shown by the pink line were also formed before the separation of the continents, and in areas are on top of the coal seams.
The yellow dots are areas where annual layers of dinosaur nests have been discovered. Just north of Spain, they are above both the coal seams and the sponge reefs. This alone gives evidence that a lot more than one year was required for this series of depositions. There are Cenozoic strata in Spain, as well, with related fossils, on top of the other strata mentioned above. The data from many more areas of geology also give convincing evidence that there is no way one flood could have produced the majority of the geologic strata and their associated fossils -- especially the violent flood of Noah's time.
V. ATOMIC TIME AND ORBITAL TIME SINCE PELEG The speed of light and nearby galaxy groups There is an additional consideration here. Our Milky Way Galaxy is part of what astronomers call the Local Group. These are represented by the white dots near the center of the picture below. "Light Years" are distances -- the distance light travels in one of our calendar years today. This picture shows how far, in light years, the nearest groups of galaxies outside our Local Group are.
Position of nearby galaxy groups compared with our Local Group. When we discussed red shift earlier, we mentioned that the common interpretation was something called a Doppler Effect, which meant that the shifting of light toward the red end of the spectrum in accord with distance was due to the motion of galaxies away from us. We mentioned that the quantized effect makes it difficult to imagine the universe expanding in fits and starts. However, if we look at the picture above, there is something that needs to be added to this. Look at the smallest arrow going out from the center, the one that stops at the M81 group, 11million light years away. It is not until we reach this distance that the quantized red shift becomes noticeable. Closer than that, and in our own Local Group, there is a definite Doppler effect caused by the movement of galaxies towards us and away from us. Thus, within this distance, we have both red and blue shifts which are indicative of movement. Within this area, as well, the blue and red shift measurements are not quantized, but show smooth functions. However, starting from within the M81 group and going further out, the red shift function goes into effect and the quantization becomes quite evident. There is no more blue shifting after M81, but only red shifting. So here again we have a ten million light year gap between us and where the red shift function actually starts in space. We need to note now that the speed of light and the rate of ticking of atomic clocks are related (see equation 9). Today one light year is the distance light travels in one ordinary calendar year. However, if the atomic clock is ticking off 1.8 million years in one orbital year, light would also travel 1.8 million light years in one ordinary orbital year. Understanding this, then we can see that as we look back in time, the redshift function begins at ten million atomic years ago. That function continues back in time to the beginning. This also means that light must have travelled 10 million light years before the redshift function was operational. This means that the true redshift function is only operational from a distance of 10 million light years away. The objects that we see closer than that are not following the primary redshift function. Therefore all members of our Local Group of galaxies come into this category. It is for this reason that genuine Doppler motion over-rides the redshift within our Local Group. The first group of galaxies outside our Local Group that are involved with the true redshift function is the M81 group at about 11 million light years distance. But we can go further. When the redshift function ended at T = 0, the rate of ticking of the atomic clock, and hence the speed of light, were about 1.78 million times their current values. The rate of ticking of atomic clocks and the speed of light at the end of the redshift function are known from equation (12) and (13). In those equations, K is the constant of proportionality which converts the speed of light, c, given in (9) to an actual value compared to the current speed of light. When the red shift function stopped, near the M81 group, or 10 million light years away, K was equal to 1.78 million. This means the speed of light now must be multiplied by that number to find the speed of light at that time. This is also how much faster than now the atomic clock was ticking. In other words there has been a significant drop in the rate of both quantities since the end of the redshift function when T = 0. This in turn indicates that the strength of the ZPE has increased since the redshift function ended (T=0). This is possible because, as mentioned above, the universe is not entirely static, but oscillates. At the time the red shift function ended, the oscillation was evidently in a contraction phase, because we see evidence of the speed of light dropping a bit sharply at that point. It is time to look at this oscillation in more detail. The time aspect of the question that now needs answering is the period of time that exists between Peleg and the present. The genealogies from Genesis 5 and 11 in the Alexandrian LXX bring us down to the time of Abraham, with his birth being 701 years after that of Peleg. Other genealogical data indicate the birth of Abraham was about 2322 BC. As a consequence, we can determine that Peleg was born in 3023 BC. This means that the end point for the redshift curve occurred in 2992 BC. If we add the 2688 years the red shift was operational, that means that the Creation event was in 5680 B.C. Note that, in this chrono-genealogical calculation, the data indicate that the second Cainan (Genesis 11) should be omitted. This decision is given more weight because both Josephus and the Samaritan Pentateuch also omit him. The red shift function gives us a measureable and steady curve up until the approximate time of Peleg, when it ended. After this our measurements indicate that the oscillation of the universe was the dominating factor, influencing further curves.
The above graph is of sound and harmonic oscillation, but it shows very clearly oscillation patterns, which is something we look for when we observe an oscillation. We have data which allows us to determine at least part of the curve during this time, as shown next. It has been demonstrated in the published papers referenced above, that atomic clocks have a run- rate that is inversely dependent on the strength of the ZPE. The lower the ZPE, the faster the run rate. This process can be used in reverse to determine the behavior of the ZPE in the past by comparing radiometric dates obtained for objects of known or approximately known orbital dates. The difference between the two dates for the same object reveals the disparity for that particular point in time. When a number of these objects of known dates are used, a curve begins to emerge which shows us how fast or slow the atomic clock was ticking at that time compared with our normal orbital clock. Figure 7 (below) is a graph of the results of just such a comparison between orbital and/or historical dates and the resultant carbon 14 dates from Reimer et al., published in Radiocarbon 46 (3), 1029-1058, (2004).
Discerning the behavior of atomic clocks The graph in Figure 7 illustrates the oscillation which shows up as part of the measurements of many atomic processes. That means this also shows the oscillation of the Zero Point Energy after Peleg. The evidence for this oscillation seems to point to its appearance starting about 2770 BC, or about 250 years after Peleg. The sharp rise in carbon content at the far right of the graph is generally attributed to the carbon being spewed into the air due to the Industrial Age. This sharp rise occurs even though the general trend of the graph at that point is downwards. If these aberrant data points are ignored, then the zero deviation line is in the position shown for 1950 (the base line date from which all carbon 14 dates are calculated. Carbon 14 dates are usually given with the annotation "BP" meaning "before present" -- which is dated as 1950.) . As we go back from 1950 we see a general rise in the trend of the graph which peaks between 500 and 800 AD. From that point there is a steady, general decline as we continue going back in time. By 500 BC it is again on the zero deviation line and continues dropping as we go back in time from there. Since the speed of light follows the same trend, it might be anticipated that c reached a secondary oscillation maximum somewhere between 500 - 800 AD also, after which it dropped down to its secondary minimum about 1970 AD. It is important to remember that these oscillations are minute compared to the original curve. If you were to continue the curve back to the beginning, from the time of Peleg back to creation, please look up to the left corner of your room and you will have idea. In order to discuss the oscillation prior to 500 BC, additional information is needed. The radiocarbon or C-14 dates require standardized and accepted corrections in order for them to be converted to historical (orbital) dates. The correction standard is often derived from tree-rings and dendro-chronological techniques. The reasons given that explain why this correction is necessary have been varied, but it has become customary to invoke changes in solar activity or the earth’s magnetic field, both of which would affect the amount of Carbon 14 in the atmosphere.. While it is true that the Sun has different cycles of 11 years, 22 years, and about 440 years, this is already apparent in the C-14 data and its short-term variations. However, the long-term overall oscillation as shown in the graph appears to have some other predominant cause. However radiocarbon dates must be consistently corrected to get the correct known historical dates (when available). There is no really satisfying solar or geomagnetic explanation for this. This correction is, however, clearly and easily explained by variation in the ZPE strength due to cosmological factors, as is evidenced in Figure 7. Reimer's 2004 data list (referenced just above the graph) and their corrections are considered to be approximately correct back to about 1550 BC. This is in basic agreement with R.H. Brown [Origins 21 (2), 1994, pp:66-79, Figure 1] who considered dates back to 3500 BP (before present) to be valid. More recent developments reported in Science, 312, p. 548 (28th April 2006) indicated that this method of C-14 dating, with the standard corrections, yields dates for the volcanic Santorini (Thera) eruption between 1627 and 1600 BC. But the closing sentence by Friedrich et al. in their Abstract indicates a long-standing problem. They say “Our result is in the range of previous, less precise, and less direct results of several scientific dating methods, but it is a century earlier than the date derived from traditional Egyptian chronologies.” The indication is, therefore, that earlier than about 1650 BC discrepancies begin to appear in the data which are a cause for some concern. [See for example the Ancient Egypt Research Associates (AERA) article “How Old are the Pyramids,” or “Dating the Pyramids” in Archaeology Abstracts 52 (5) September/October 1999, or Bonani et al., in Radiocarbon 43 (3) pp.1147 ff (May 2001)]. Prior to 1650 BC Carbon 14 relies on results from tree ring dating for calibration. However, the correction supplied by dendrochronology gives results that do not accord with known archaeological data. Several factors need to be examined here. First, the oldest living tree began growing in 2766 BC. This bristlecone pine, the “Methuselah Tree,” is nearly 1000 years older than the next living specimen. This second oldest tree thus began growing around 1700 BC or a little earlier. These two living trees provide the absolute maximum to which any reliable dendrochronology correction can be applied. Yet the longest continuous tree-ring sequence, starting near the present, that the Methuselah Tree has produced only goes back as far as 1203 BC. This is given in the sample labelled MWK975. In an effort to date further back than this, this sample is cross-matched with other, older parts of the same tree. Problems arising from this method are discussed a bit later. Since a similar situation may apply to the second oldest tree, the actual date at which these two trees really began growing may be open to question. The raw data itself, in 10 year intervals for the Methuselah Tree, is available on the web. Second, these tree-ring sequences need to be anchored by historical events. Indeed, R.H. Brown, (Origins 21 (2), 1994, pp:66-79) has stated that “The validity of tree-ring master sequences on which the data is based is controlled by the availability of material which can be C-14 dated and also has an unquestioned historical age. The time range from which such samples are available extends to the vicinity of 3500 BP (about 1500 BC).” It therefore becomes apparent why this system of correction breaks down for dates earlier than about 1650 BC. The Santorini explosion is the last historical event that shows up in the tree-ring sequences. Baillie and Munro have pointed out that it does so as frost-rings in Irish (bog) oaks [Nature, 332 (1988), pp. 344-346]. The bristlecone pine data also have a significant frost ring event for 1626 BC [V.C. LaMarche and K.K. Hirschboeck, Nature, 307 (1984), pp.121-126]. Radiocarbon dates compared with historical dates Third, the C-14 results seem to show some divergence from historical dates even around 1626 BC, and, as mentioned above, the problem appears to get worse the further back we go. Therefore, 1650 BC is taken as the limit to which reliable corrections can be applied. The statistical ‘wiggle matching’ techniques used to extend the tree-ring chronology further back into the past can only do so after the tree ring sample has first been C-14 dated. This is an extension based on a circular argument (you want to verify the carbon sample by the tree rings but you cannot do so until the tree rings have been carbon-14 dated). The results obtained this way must therefore be viewed with extreme caution. This is emphasized by the comments of D.K. Yamaguchi who, when trying to match a single tree to the whole sequence of rings, found 113 matches that were false. Yet each of these matches had a high t-statistic score, or a very good statistical match [D.K. Yamaguchi, Tree Ring Bulletin 46:47-54 (1986)]. Nor is this a problem of the past. Grissino-Mayer et al. stated in 2004 that “crossdating autocorrelated tree-ring series against a reference chronology can result in many ‘false positives’, i.e., a placement may be found for the chronology being dated that is temporally [time] incorrect.” [Journal of Archaeological Science, 31:167-174 (2004)]. Indeed, the statistical techniques used for tree-ring matching have produced some degree of embarrassment. On three occasions the published matches were found to be in error, each time after strong assertions of reliability [M.G.L. Baillie, “A Slice Through Time: dendrochronology and precision dating”, Chapter 2, London: Batsford, (1995), and M. Spurk et. al., Radiocarbon 40:1107-1116 (1998)]. Because of these factors, 1650 BC is taken as the reliable limit to which C-14 corrections based on dendrochronology can be taken. However, we have further information. J. Baines and J. Malek in “Atlas of Ancient Egypt,” p. 36, point out that archaeological evidence indicates that the Second Dynasty in Egypt began about 2770 BC. This has been backed up by C-14 dating as F. A. Hassan has pointed out in an article entitled “Radio-Carbon Chronology of Archaic Egypt” in the Journal of Near Eastern Studies, volume 39, pp.203-207 in 1980. This date of 2770 BC is also suggested by the Sothic Cycle. This Cycle comes about from the following circumstance. Like us, Egypt possessed a 365 day civil calendar. However the time it takes the earth to go around the sun is about a quarter of a day extra every year. We have accounted for this by adding February 29 once every four years. The actual, or Sidereal year, can be calculated by checking exact astronomical positions. However the Egyptians did not add an extra day every four years, nor did they account for the extra time in any other way. The earth will be in exactly the same place relative to the background stars at the same time each orbital year. Therefore, repeating astronomical events can be used to give fundamental dates with some accuracy. If we look up at the night sky at different times through the night, the stars appear to move across the sky. They are not moving, we are. As we rotate on our axis, the stars move in an arc across the sky. However, because we also circle around the sun, the panorama of nighttime stars will change as the seasons pass. Stars that were near the horizon in the autumn may be below the horizon in the winter, or, conversely, may be high above the horizon. It depends on where we are on earth and where the earth is in relation to the background of stars. The Egyptians had one annual event that they watched for carefully. They noted on their records the rising of the star Sirius in the first rays of the dawn. Sirius is the brightest star in the sky. Although planets like Jupiter and Venus and Mars can sometimes be brighter, they move against the background stars. Sirius, being a star and not a planet, does not move. However, we move. During the early part of our year, in the spring, Sirius, if we could see it, rises after the sun has come up. So we see it at night high in the southwest before it 'sets.' By July 20th, however, our position in our circle around the sun has changed enough so that Sirius is seen to rise in the east just before the sun comes up. This is called a heliacal rising. It is this event the Egyptians watched for, for it signaled the imminent annual flooding of the Nile, upon which their lives depended. After this date, Sirius is rising well before the sun, so it was that first glimpse of Sirius in the early dawn sky that was watched for.
The above diagrams show Sirius (the white star) before the sun comes up, which is before July 20, then a little after the sun comes up in the second picture, which is actually a day or two past its heliacal rising, and some days later in the third picture where it is rising well before the sun comes up.
It would be just before this sunrise that the star would appear, something like what is shown in the picture below.
This event marked the first day of the first Egyptian month, and it began the season of the inundation of the Nile. Named the Sothis star, it appeared on the 20th July on our calendar. Now the Egyptian civil calendar was one quarter of a day short every year. As a consequence, astronomical events fell one day earlier every four Egyptian years. Inevitably, the Sothis star, the Nile inundation, and the seasons gradually moved through their civil calendar year. Eventually what should have been July 20 on our calendars would slip through autumn and then winter and then spring as the years went by until it was finally 'July 20' on time again. As a result of this, when a period of [4 x 365] 1460 Egyptian calendar years, or [4 x 365.25] 1461 Julian calendar years had elapsed, the heliacal rising of Sirius was again observed on the first day of the first Egyptian month, or our July 20. This period of 1460 years or so is called the Sothic Cycle. When all factors and observations are taken into consideration, this Cycle can range from 1453 up to 1461 years. This is because a year is not quite exactly 365 and 1/4 days. So the Sothic Cycle is as 1457 +/- 4 years. This error of +/- 4 years amounts to a difference of only one day in the appearance of the Sothis Star. When the Sothic Cycle began and ended The initiation or termination date of this Cycle now needs to be discovered. In 238 AD, Censorinus wrote a treatise in Latin called ‘De die Natali liber’ in which he cross-linked the Roman and Egyptian calendars for the Heliacal rising of Sirius. From his data, it can be shown that the 1st day of the first Egyptian month (Thoth 1st) coincided with the rising of Sirius on 21st July, as required, in 139 AD. This marked the close of one Cycle and the beginning of another. This is confirmed by several other lines of investigation, including the statement by the astronomer Theon of Alexandria who held office during the reign of Theodosius the Elder. From a date during the reign of Diocletian in 285 AD, Theon noted that precisely 1605 years had elapsed since the commencement of the new era. This meant that the new era began in 1320 BC, and that the complete cycle lasted [1320+139] 1458 years. Other statements and data can be traced back through the previous cycle that ended in 1320 BC. This means the earlier cycle began about [1320 + 1457] 2777 BC with an error of +/- 8 years. This date of 2777 BC clearly correlates with the 2770 BC for the inception of the 2nd Dynasty from both other historical as well as the radiocarbon data. This 'coincidence' strongly suggests that the beginning of the 2nd Dynasty may have been marked by the inception of the Sothic Cycle, as the Egyptian calendar was based on the flooding of the Nile. At this point, then, we are able to fill in part of the gap between when the red shift function ended and 1650 B.C., which is the last reliable dendrochronology/C-14 dating we have. There is additional evidence from the time of the construction of the Pyramids at Giza. Historically, Dynasty 4 in Egypt produced these pyramids over a span of some 85 years which archaeological studies suggest was centered around 2550 BC. Indeed, Baines and Malik in “Atlas of Ancient Egypt” (Oxford 1980), p.36 indicate that Pharoah Khufu (Cheops) ruled from 2551 to 2528 BC. The “Cambridge Ancient History” 3rd edition 1971, Volume 1 Part 2 suggests a similar date. Their dates agree with information from the Sothic Cycle studies. But now we find an interesting problem arising from the carbon 14 data. The raw C-14 data themselves agree with these dates as posted above. In order to understand what is happening with the 'official' dating, we need to remember about the oscillation of the universe itself. When the redshift function ended (when the ZPE had finished building) the universe was evidently in a contraction phase and so we have atomic processes themselves responding with an even further drop in their rates -- the contraction was 'condensing' the ZPE thus having the same effect as if the ZPE was increasing. If we check the actual data on Figure 7, we can see that the contraction ceased and an expansion began about 1600-1700 B.C. Interestingly, this is just about the time C-14 dating and dendrochonology reach their last point of accuracy. This is no accident. The scientists who do the C-14 calibrations can see the data going 'downhill' as they look back in time and the assumption is that this trend simply continued. For this reason as well as the use of statistical 'wiggle matching' with dendrochronology, the standard procedure is to add 300 years to the C-14 dates around 2550. They considered the raw C-14 data to be giving dates that were 300 years too young. In fact, the raw data from the carbon dating agrees with the Sothic Cycle dating and the dates referenced above as well. In 1984 and 1995 the members of the David H. Koch Pyramids Radiocarbon Project obtained many C-14 samples and published the Abstract containing their results in Archaeology, 52 (5), Sept/Oct 1999. The 1984 results gave a carbon 14 age that averaged 374 years older than the recommended Cambridge Ancient History historical dates when the 300 year addition had been applied. In 1995 the C-14 results ranged from 100 to 350 years older than the historical data after the correction had been applied. Data from Bonani et al. support the idea that the raw C-14 dates are, in fact correct historically. Regardless, the standard produre added about 300 years to the C-14 data. But that resultant date is averaging about 300 years too old. This means that the uncorrected C-14 date and the historical date were about the same. These data dealing with the period around 2500 B.C. can be cross-checked since we have an independent atomic clock at our disposal in this case. In April 2002, M A Sekkina et al. published the results of their research on pottery that was associated with the Giza pyramids construction in Ceramics-Silikaty 47:3 (2003), pp.94-99. Using thermo-luminescence for dating, they derived an upper maximum age for these 4th Dynasty objects ranging from 2604 to 2552 BC. According to Baines and Malik, the 4th Dynasty began about 2575 BC, so this maximum range in the data corresponds very well with other archaeological data used to assess this dynasty. Some concordant results were obtained by M S Abdel-Wahab et al. who worked on pottery from the same period and published in Radiation Physics and Chemistry 47:5 (1996), pp.697-700. In other words, thermo-luminescence has also given us a date that is concordant with the uncorrected carbon 14 date. This means that the standard dendro-correction from wiggle-matching is invalid at this point and that a zero correction applies to the radiocarbon clock at this time. In other words, atomic clocks around 2550 BC were ticking at roughly the same rate as today. It should be noted that the thermo-luminescence technique is independent of the problems with C-14. This technique relies on the fact that naturally occurring crystalline material such as grains of quartz, zircon, feldspar or other material which is used in making pottery, contain imperfections. These imperfections trap particles which originate from the natural radioactivity which occurs in the area where they are found. This dating was done on pottery found in the pyramid area which was known to be dating from the Fourth Dynasty. When the pottery shards are heated in the laboratory, the heat gives these particles sufficient energy to escape, emitting photons of light in the process. The resulting luminescence can be detected and measured. The amount of light emitted is proportional to the radiation dose accumulated over the period of time between the original firing of the pottery and the re-heating in the lab. (These atomic clocks can be 're-set' if reheated between that time and this, but these pottery pieces have been found next to the pyramids, and there has been no volcanic or other heating activity there since the pyramids were built.) The radiation accumulated through the years by the pottery is dependent on the rate of naturally occurring radioactivity in the area. This also gives us a form of atomic clock, which is dependent on the strength of the Zero Point Energy. This atomic clock was set ticking when the sample was initially heated at the time the pottery was fired, and the sample started accumulating particles from natural radioactivity at that point in time. There are two carbon 14 data points on Figure 7, which are from the 1984 and 1995 and have been cross-checked with thermo-luminescence data. They are on the far left of Figure 7. Thus, going backwards in time, the actual curve prior to 1650 BC rose from near a minimum then to reach a near-zero-correction level again near 2550 BC. The Pyramids Radiocarbon Project indicate that this situation pertained at least to the time of Pharaoh Djoser in Dynasty 3 around 2630 BC. This indicates that as we go back in time from 2550 BC to 2630 BC the approximately zero-correction is still holding. Since archaeology, astronomy and C-14 dates all are coincident at 2770 BC, this means that, during the period from 2550 BC to 2770 BC, an approximately zero correction is needed for atomic clocks. This in turn means that, throughout this period, these clocks were ticking at approximately the same rate as today and the speed of light was about the same as today. In other words, there was a flat point in the oscillation curve at that juncture. (If there is symmetry in the oscillation curve, this may suggest that the flat point reached in 1970 AD may continue for some time, though perhaps rising slightly.) Let's look at the atomic clock graph again:
The middle line, on which the years are marked, can be used to indicate the rate of atomic processes today. We can see that this rate was duplicated about 500 B.C. However, if we look further back, to the far left of the graph, we see those two 'dots' which mark measurements not only indicated by Carbon 14 dating but also by thermo-luminescent dating. The lower of those two dots indicates that the atomic processes at about 2500 B.C. were again approximately what they are today and were about 500 B.C. This is the oscillation in effect. Thus, from some time before 2500 B.C. the rates had been dropping until we see the low point on the graph, at somewhere between 1700 - 1600 B.C. This drop had been in effect since the end of the red shift function about the time of Peleg. Off the graph, to the left, going back in time from 2770 BC the graph is rising, which means the atomic clocks were slowing from a previous higher value compared with today’s values. This is indicated by the Egyptian data which suggests that the atomic clock rate was decreasing throughout the first Dynasty. Baines and Malek show the 1st Dynasty started historically about 2920 BC. This agrees with all the data presented above. However it is here where radio carbon dating runs into a problem again. The assumption is made by those doing the dating that all atomic rates have been steady through time. It is because that assumption did not hold with the raw data that they felt constrained to add three hundred years to the dates around 2500 B.C. But as we go back to the First Dynasty, which is off the graph to the left, when the atomic processes were faster than today, the opposite problem occurs. The evidence comes from Baines and Malek shows the 1st Dynasty started historically about 2920 BC. This agrees with the Sothic Cycle. However, the raw C-14 dates from Bonani et al. register up to 400 years earlier. This indicates the atomic clock at that time was ticking much faster than now. Geological and archaeological summary Considering everything above, then, the only data we are lacking is in the period from 2800 BC to 2992 BC, a stretch of 192 years. It was in this stretch of 192 years that the atomic clock rate was dropping quickly at first, then more slowly at time went on. In this way the extra 10 million atomic years had built up by 2992 BC and in such a way that, by that date, atomic clocks were ticking 1.78 million times faster than now. The following two chronological tables can now be established from the foregoing data. Table 1 summarizes the geological data in atomic time converted to orbital time using atomic clock behavior from Figure 5. The resulting synchronization with events in Genesis 1-11 then becomes apparent. Table 2 deals with the data from the oscillation curve shown in Figure 7 and is an archaeological comparison with Biblical events for several Near Eastern civilizations.
TABLE 1: Geological Eras and atomic clock conversions to orbital time
1220-1180 -- "Sea People" invade east Mediterranean, destroying empires, introduce iron.
Following the data itself is a strenuous and time-consuming proposition. It is very hard to divest oneself of presuppositions and formerly held theories. However, when this is done, the results can be astonishing, to say the least. Whereas the commonly held and taught gravitational model of the Big Bang has presented problem after problem and required the invention of unseen dark matter, force, and energy, work with plasma filaments has demonstrated that what we see in space exactly matches what happens in the lab. In like manner, whereas quantum physics is involved with esoteric principles and maths, classical physics, when incorporating what is known and understood about the Zero Point Energy, is more than sufficient to account for known processes. A number of atomic constants have been declared to be constant, despite years of measurements showing directional trends. When we go back to the data, and dig out all the actual data available, and see where it leads, we find what we have presented above. While we look to both modern science and its discoveries as well as to the Bible for clues about the past, our aim has been to let the data speak for itself. The results point to the evidence that the Big Bang model is false, and so is the standard creation model. While the universe is quite young, one flood could not and did not result in the geologic column, which does exist, and its associated fossils. Out beyond earth, we see that space is full of plasma filaments, and we can see how they interact in the lab. We can see that a number of atomic constants have been measured for years as not being constant at all. When we gather all the data available, several conclusions become apparent:
Thus, without the need for fancy explanations from either the standard model taught in our universities, or the main creation models, the data is simply and clearly there for those who wish to take note. -------------------------------------
|
