Sunspots, solar activity and weather
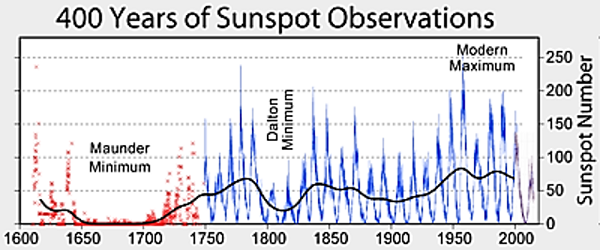
You ask a number of questions relating to Earth’s weather, the sun’s activity and the magnetic field, auroras etc., and suggest that Jet-stream behavior may be linked in some way. In response to these questions, let us look at the solar mechanisms driving our weather and see how the system works. As we have stated before, the primary driving force is the Sun. You asked specifically if there was any way that the total energy output of the sun was related to earth’s weather. There are two aspects to this; first there is the direct radiative heating of the earth’s atmosphere and oceans, particularly in the region between the Tropics. This has been discussed elsewhere. However, there is a second aspect to this and that is cloud formation. Low altitude (LA) clouds reflect the sun’s radiation back into space, yet do not trap much in. As a result, more LA clouds mean a cooler earth. This is an interesting trail to explore. These steps may help mark the trail.
Experimental Proof:
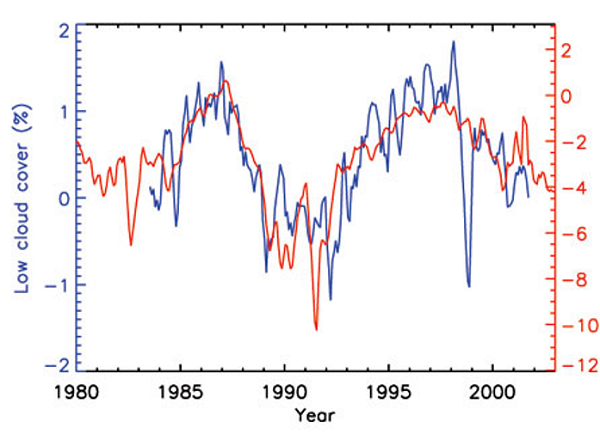
The graph below shows the link between cosmic ray flux (orange) and the low altitude cloud cover (blue). The average temperatures follow the same graph. This supports Graph 1 above.
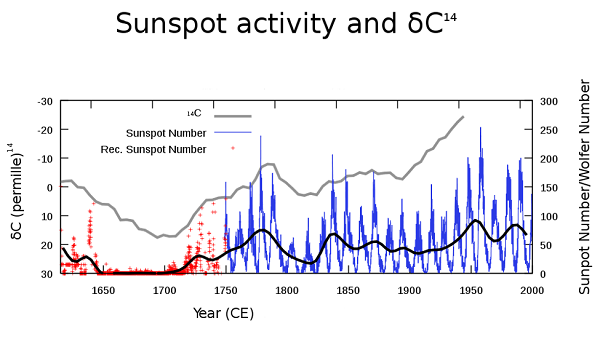
The correlation between cosmic ray flux (orange) as measured in Neutron count monitors in low magnetic latitudes, and the low altitude cloud cover (blue) using ISCCP satellite data set, following Marsh & Svensmark, 2003. The top line in the third graph (below) reveals the change in the carbon 14 content in tree rings over the last 400 years. These rings can be accurately dated by visual counting in cores from live trees. This top line of varying carbon 14 content seems to have followed the sunspot activity. For this reason, the change in the carbon 14 fraction from tree rings has been used as a climate indicator back for several thousand years. This is one way of tracking climate events.
You ask about the magnetic energy of sun and earth and their interaction producing auroras and its relationship to the weather. Auroras are produced by the stream of particles from the sun called the solar wind or other solar phenomena. These phenomena are at their peak when the sun is most active and therefore most energetic. Among these phenomena are sunspots and coronal mass ejections. These particles ejected from the sun are funneled into the earth’s magnetic polar regions since these are the only two gaps in our plasmasphere (which protects us). As these particles stream down to earth in our polar regions, they are effectively an electric current, since moving charged particles are what makes up an electric current. Indeed, up to a million amps has been recorded flowing this way. This current causes the plasma making up our upper atmosphere to glow in the same way as a neon tube glows. Therefore, a record of auroras gives us a general idea of how active the sun is or has been at a given time in the past. It can be coupled with sunspots & the extent of the sun’s corona during a total solar eclipse (bigger for more active sun) to give an idea of conditions linked with earth’s weather. You mention electric currents in Norway. Norway is within the polar circle magnetically, so currents linked with auroras inevitably flow into and out of the ground there as the circuit must be completed. The currents from the sun are obviously stronger when the Sun is more active, and auroras more frequent and can be seen further away from the magnetic poles. You ask if the lessening of the strength of the earth’s magnetic field has any effect on the shape or position of the jet streams near our poles. If they do, then the currents from the sun might be expected to play a part also. However, the jet streams seem to be more directly linked with axial tilt & Hadley Cell & similar formations and related phenomena rather than with electric or magnetic fields or currents. To be more definitive than that, I would need to do further research on that topic when some time becomes available. I hope that is some help to you.
|


